
This is MY outlook for the coming winter as it stands now. Changes in data may require adjustments after final info from November becomes available.
I will issue a final winter outlook IF NECESSARY by the start of December.
I showed you in the previous blog on the topic the overwhelming majority of computer models call for a warm winter with a rough split between wet and dry.
I don’t use the models that much but use other techniques for long-range forecasting developed before the computer era.
These include teleconnections and analogs. I’ve explained this in great detail many times over the past decade or so.
Over-simplifying, there are key spots around the worlds oceans that have been found to be signals to the weather weeks and months in advance as far as average jet stream and weather. There are also a number of indices that have been developed that show correlations to the weather weeks and months ahead.
So this method looks at all of those and matches the current ones to the closet past examples from history. Then a composite of that past weather history is used to project the future with the idea that what is past is prologue. Weather and climate rarely repeat exactly but similar patterns do repeat.
Just keep in mind similar is not equal to the same. As they say on Wall Street, past performance does not guarantee future results.
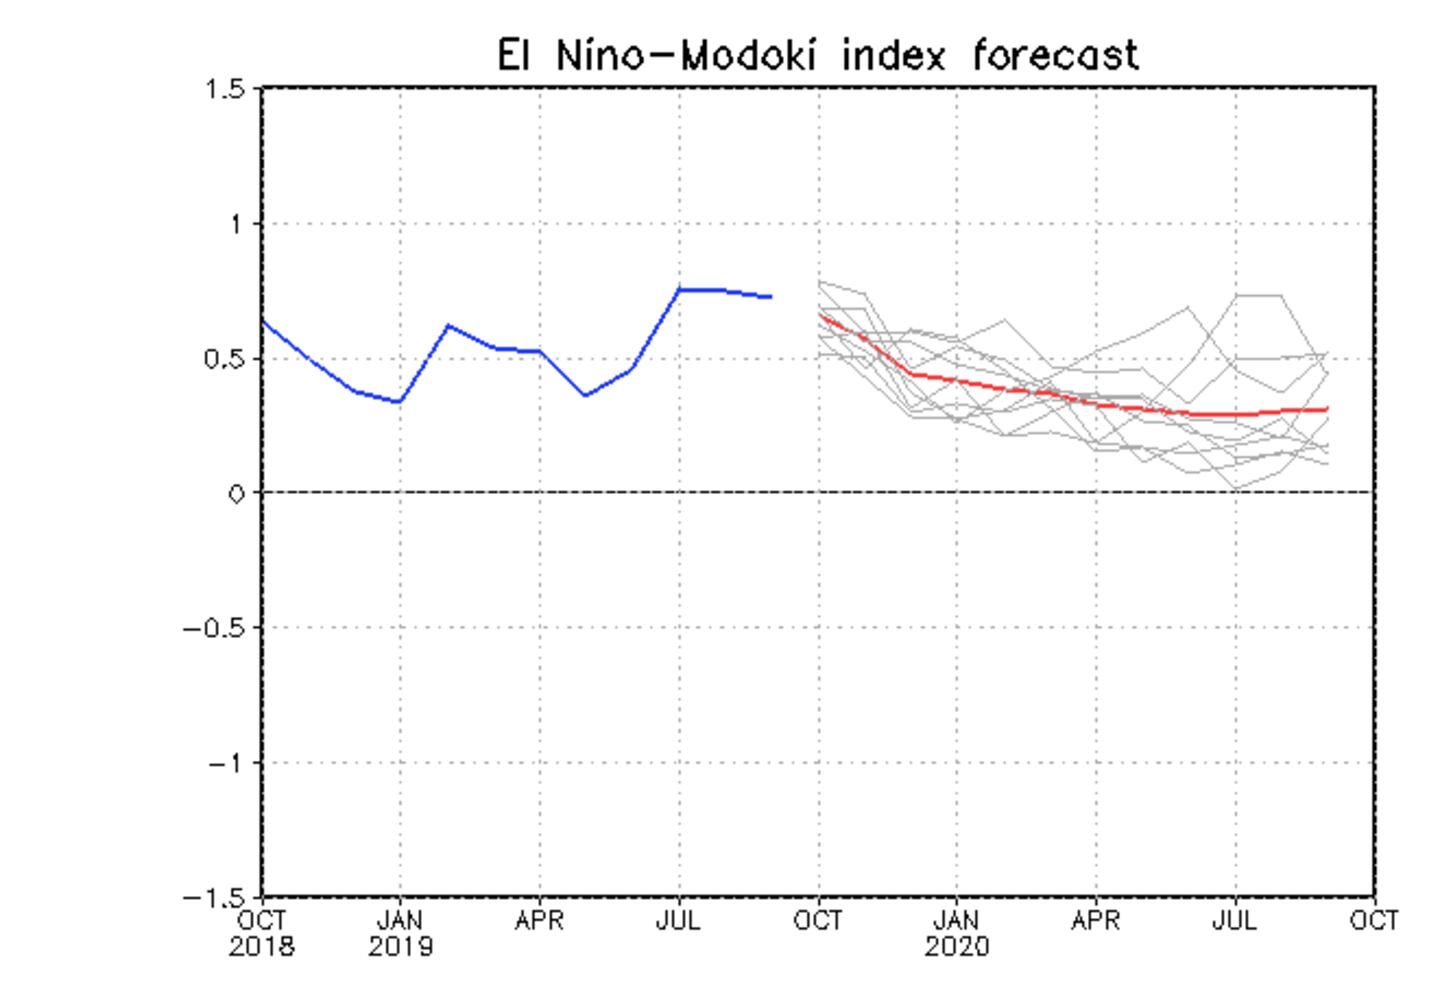
I pointed out that this year the ENSO (El Nino Southern Oscillation) condition is currently weak and near-neutral and is forecast to remain such through the winter as shown in the first chart above.
A West-Central based weak “Modoki” El Nino is possible. Index forecast from Japan Met Agency:
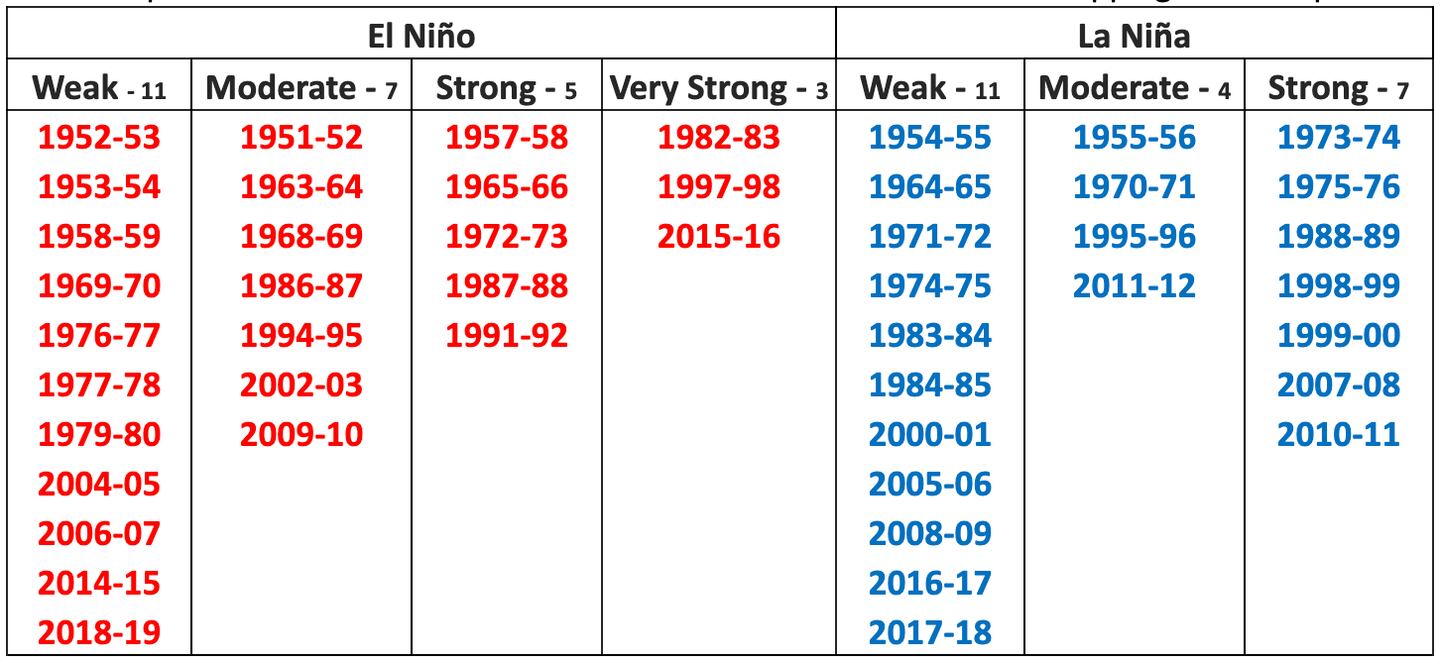
PAST ENSO CLASSIFICATIONS:
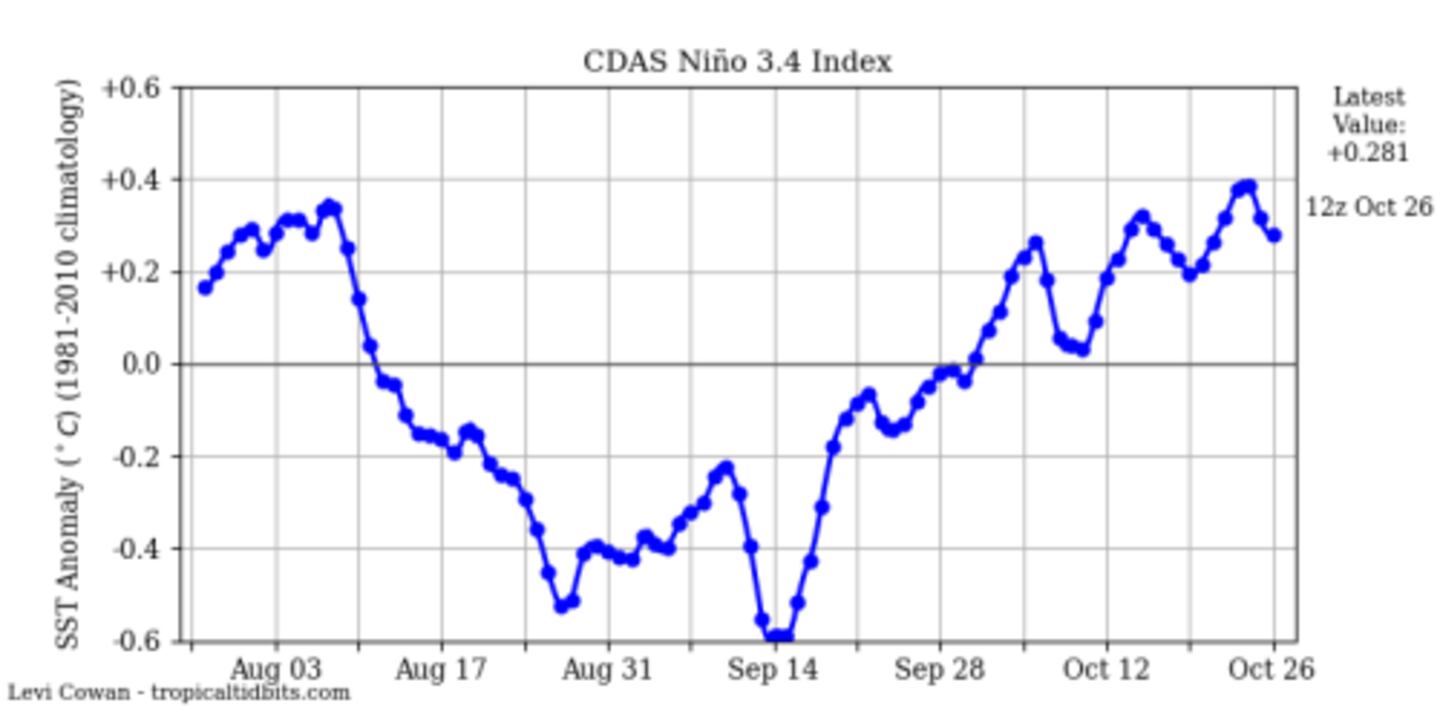
EL NINO PACIFIC OCEAN REGION 3.4 FORECAST:

Since the Pacific Ocean is such a major climate and weather driver when the ENSO is in a neutral or "La Nada" state (neither a clear El Nino NOR a clear La Nina) then other less predictable drivers will end up determining how the winter plays out. This raises the risk of a forecast bust and/or of a highly variable Fall, Winter and Spring pattern.
The Western Tropical Pacific is a crucial source region for the planetary circulation.
The ENSO situation also indicates a higher than normal BUST potential because of what happened last winter and what has been observed ever since. That is, many times the atmosphere and the oceans have been “decoupled”, normally they are coupled so the overlying jet stream behaves on a par with past years with similar Pacific Ocean temperature patterns. But last year and so far this year the correlation has been off. If this continues it will throw off the forecast again.
A PARTIAL LIST of things looked at to make a winter outlook: ENSO including SSTA, ONI, MEI, EPO, WPO, NHI, MJO, TNH, QBO, PDO, AMO, AO, NAO, PNA, PMM, TNI, Global AAM, Indian Ocean Dipole IOD, North Pacific “Blob”, SSWE/Blocking indicators, Northern Hemisphere (Eurasia) Snow Cover advance, Arctic ice anomaly, Solar Cycle (Sunspots), Volcanic activity-atmospheric aerosol levels, multi-decade trends and persistence of recent winters (base state), hurricane season, summer and autumn weather, Fall storm tracks, climate trends, and more.
Of course these are in a constant state of flux so they can end up behaving differently from expectation thus leading to a wrong forecast.
We forecast based off where and how these things line up NOW, but they can and do change on us. For example, autumn storms can disrupt the current sea-surface temperatures and alter current expectations.
Long-range seasonal forecasting is still in its infancy compared to daily forecasting, thus a forecast for a month or more in advance has been shown scientifically to be BETTER than guessing but not by that much.
I am not going to run-down all the factors in the interest of brevity, but I’ll show you a couple things being looked at for this winter.
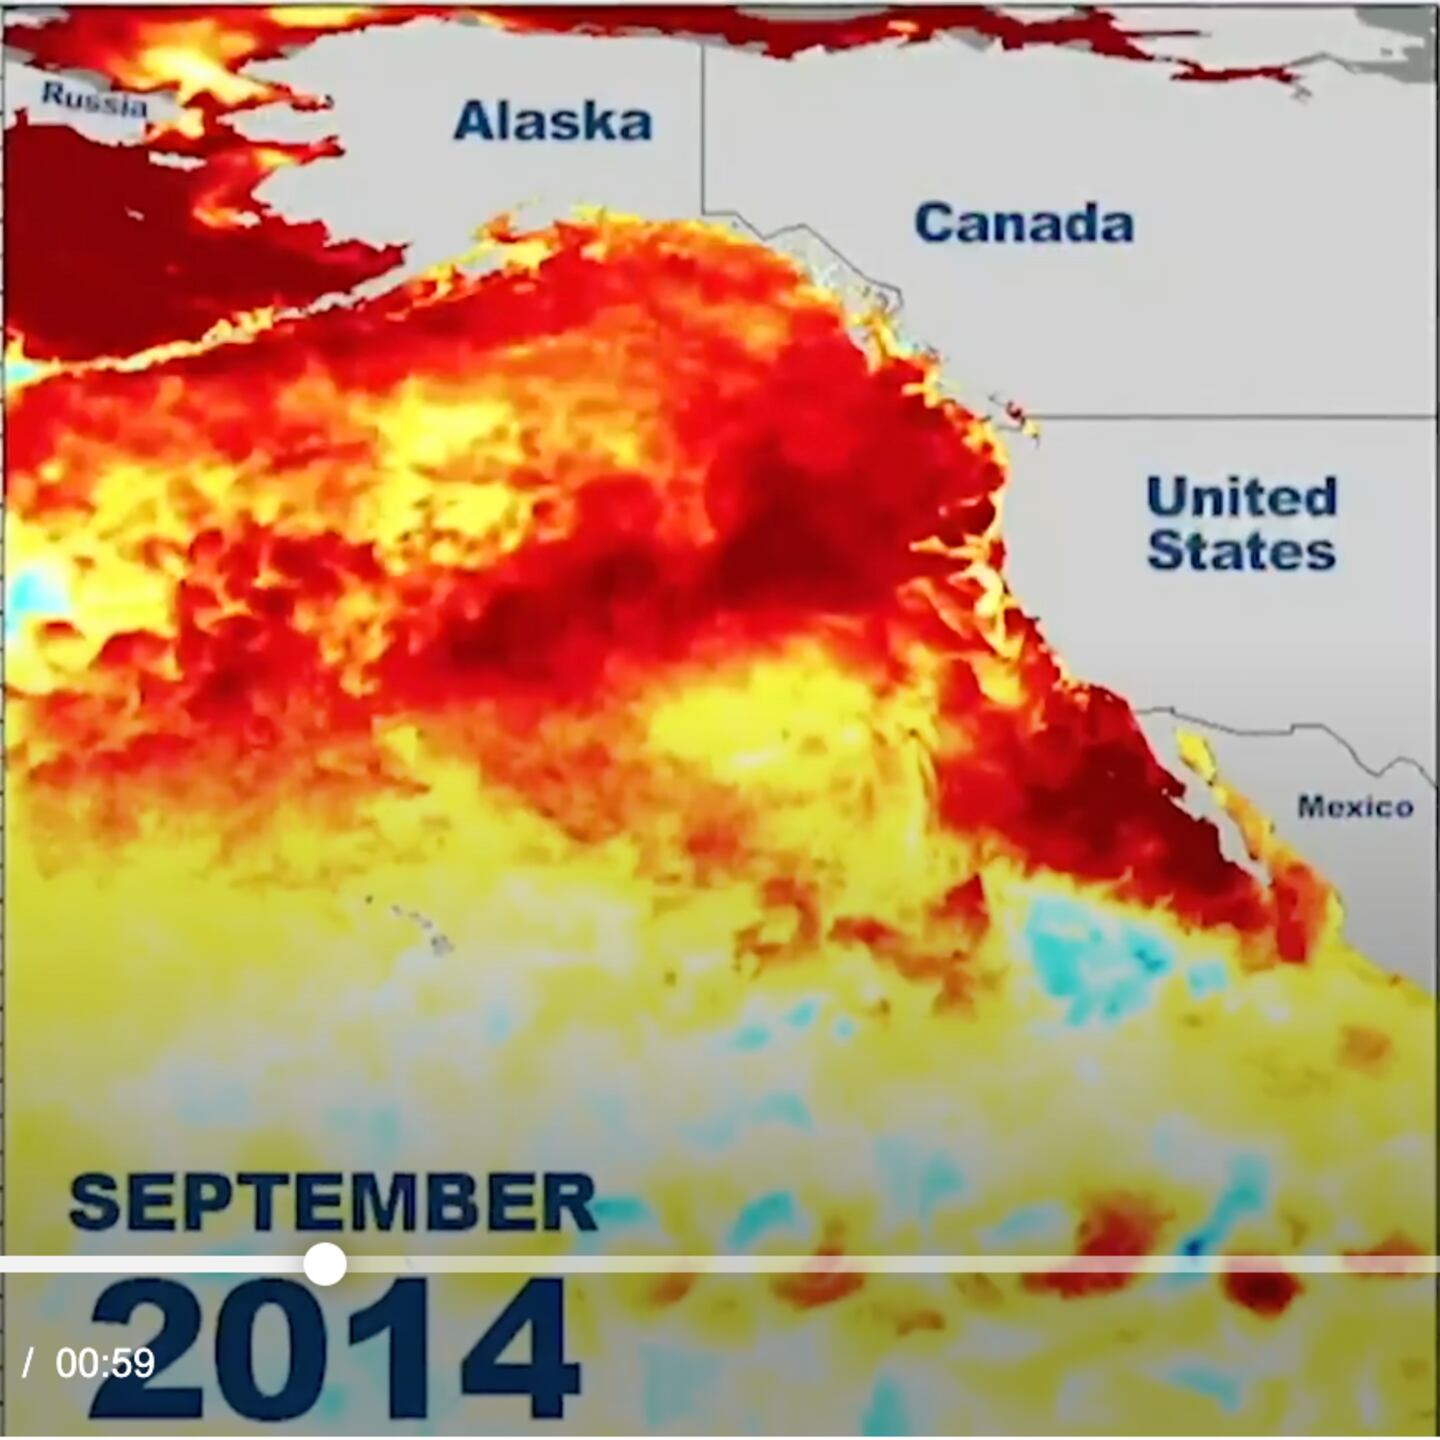
One example is a warm NE Pacific nick-named "The Blob" (by a researcher at the University of Washington):
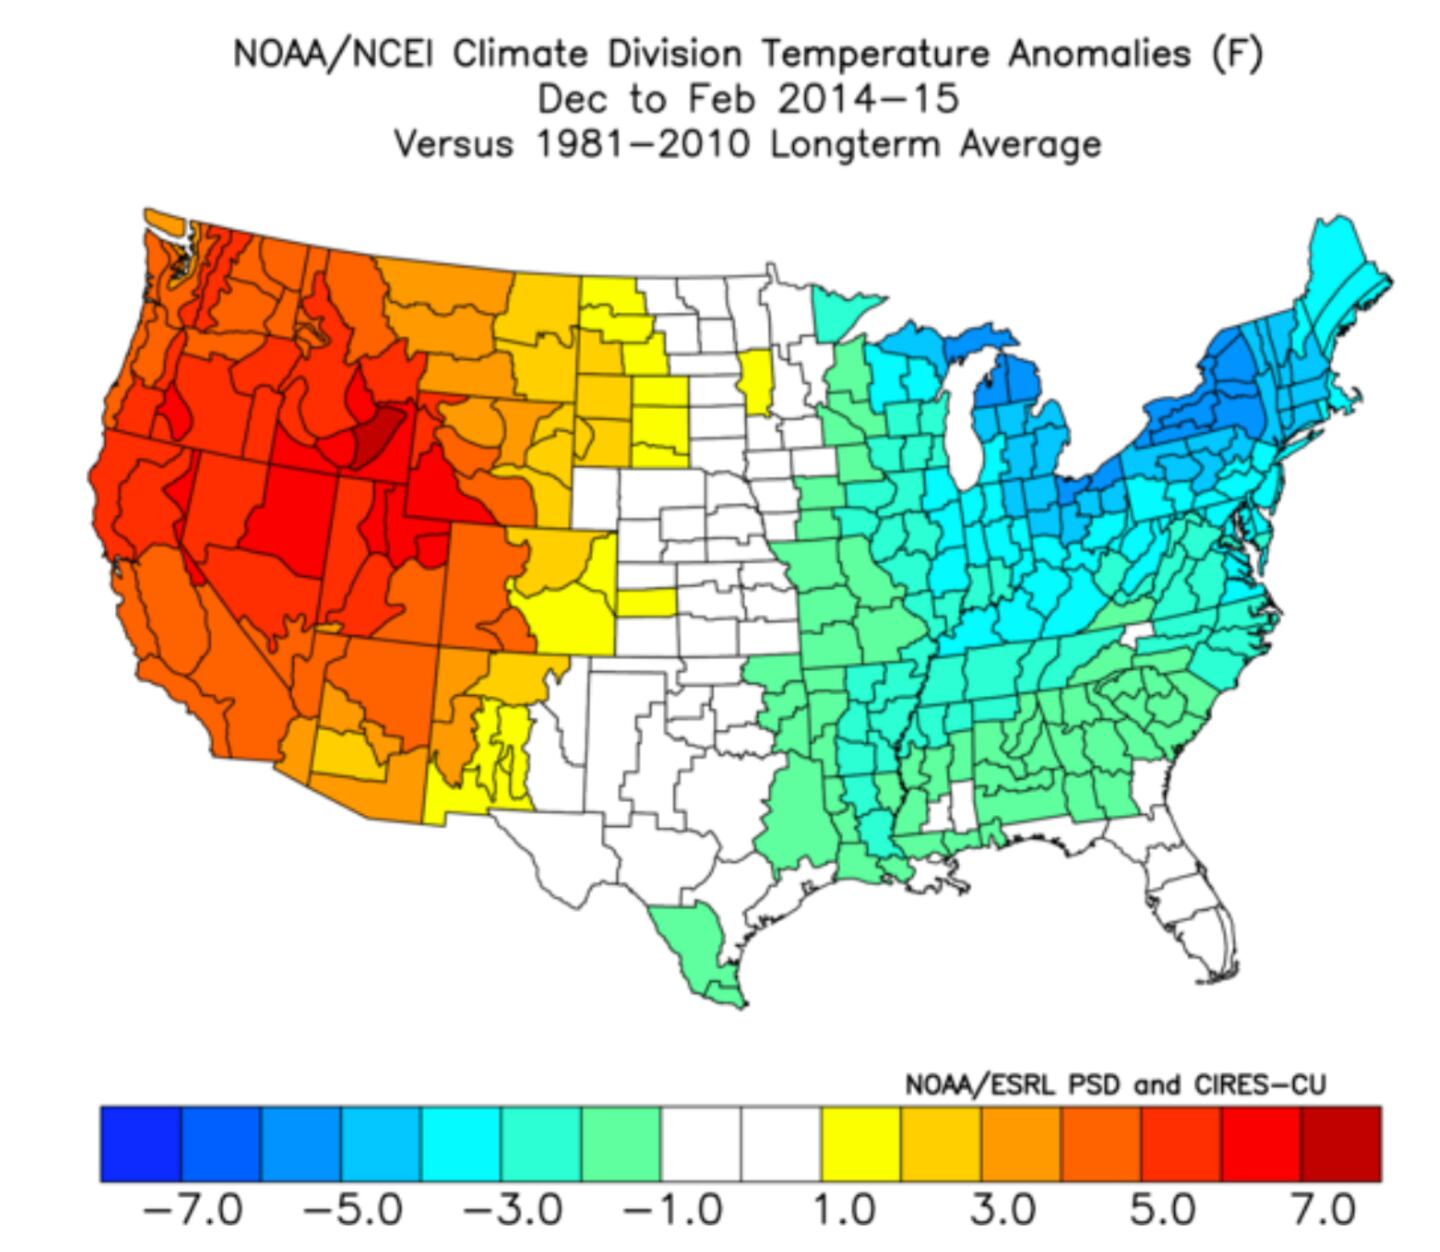
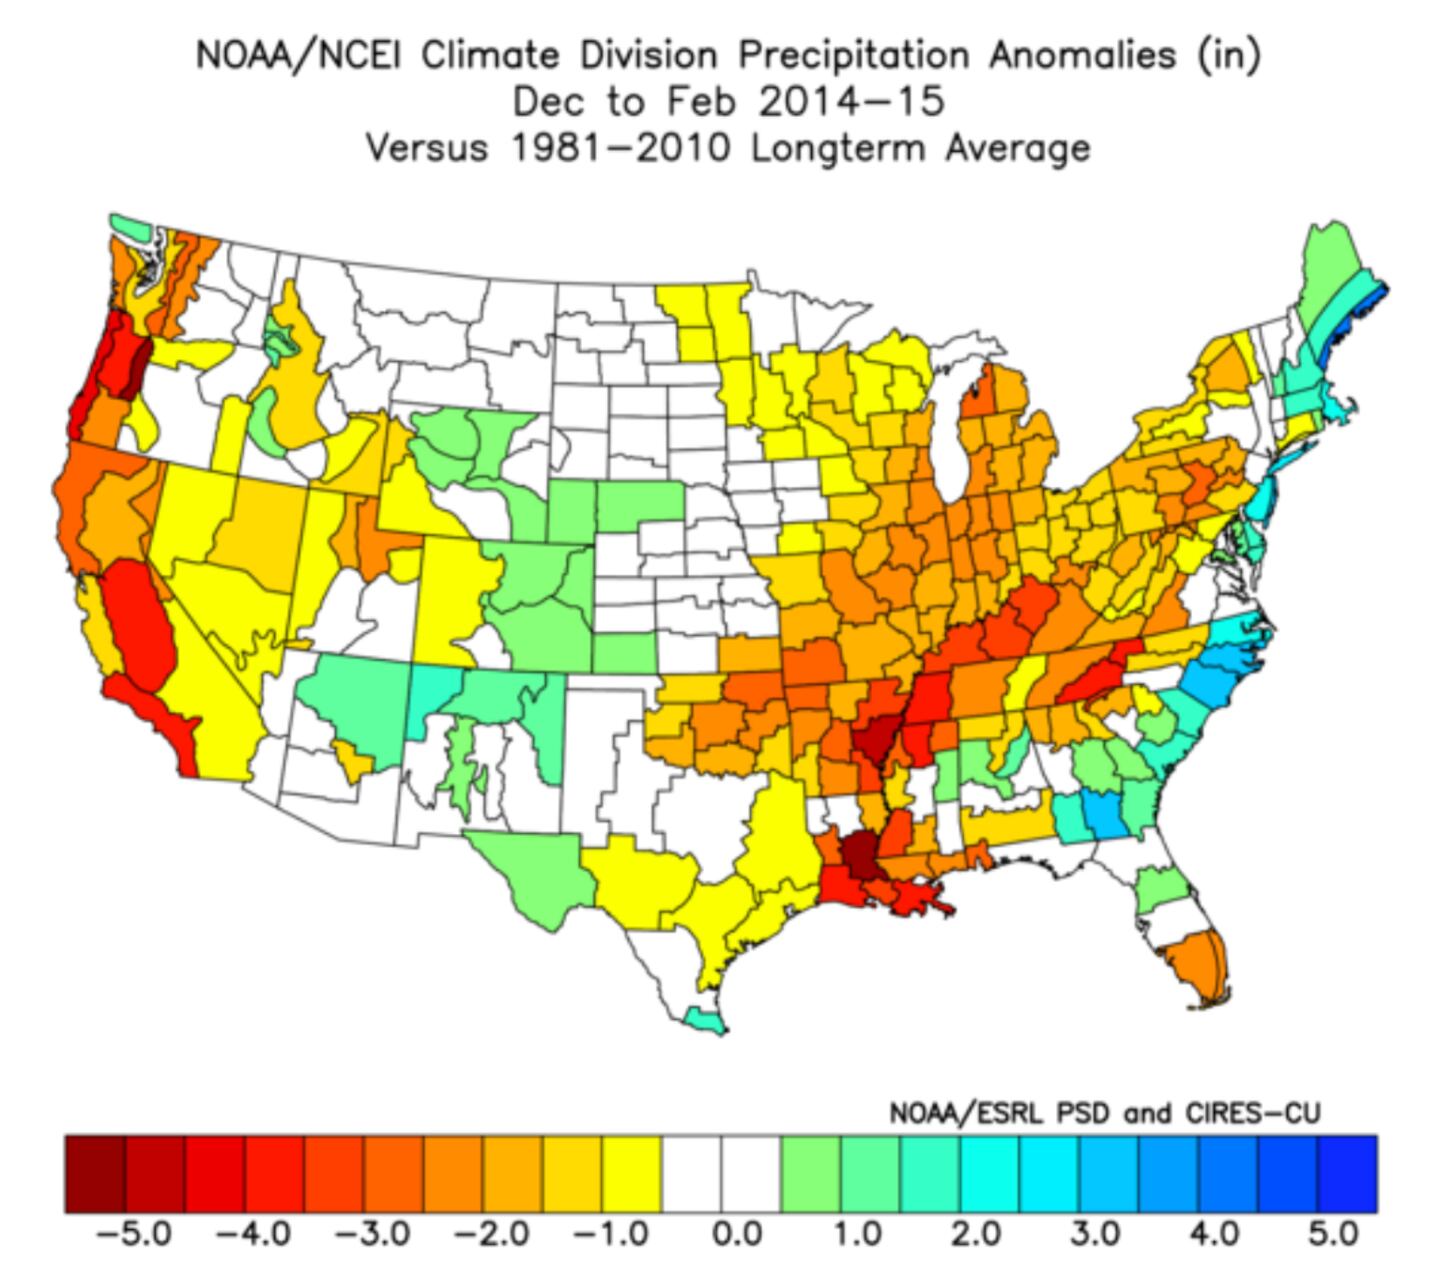
What winter jet stream pattern averaged that winter:
Resulting average winter that year 2014:
THIS YEAR:
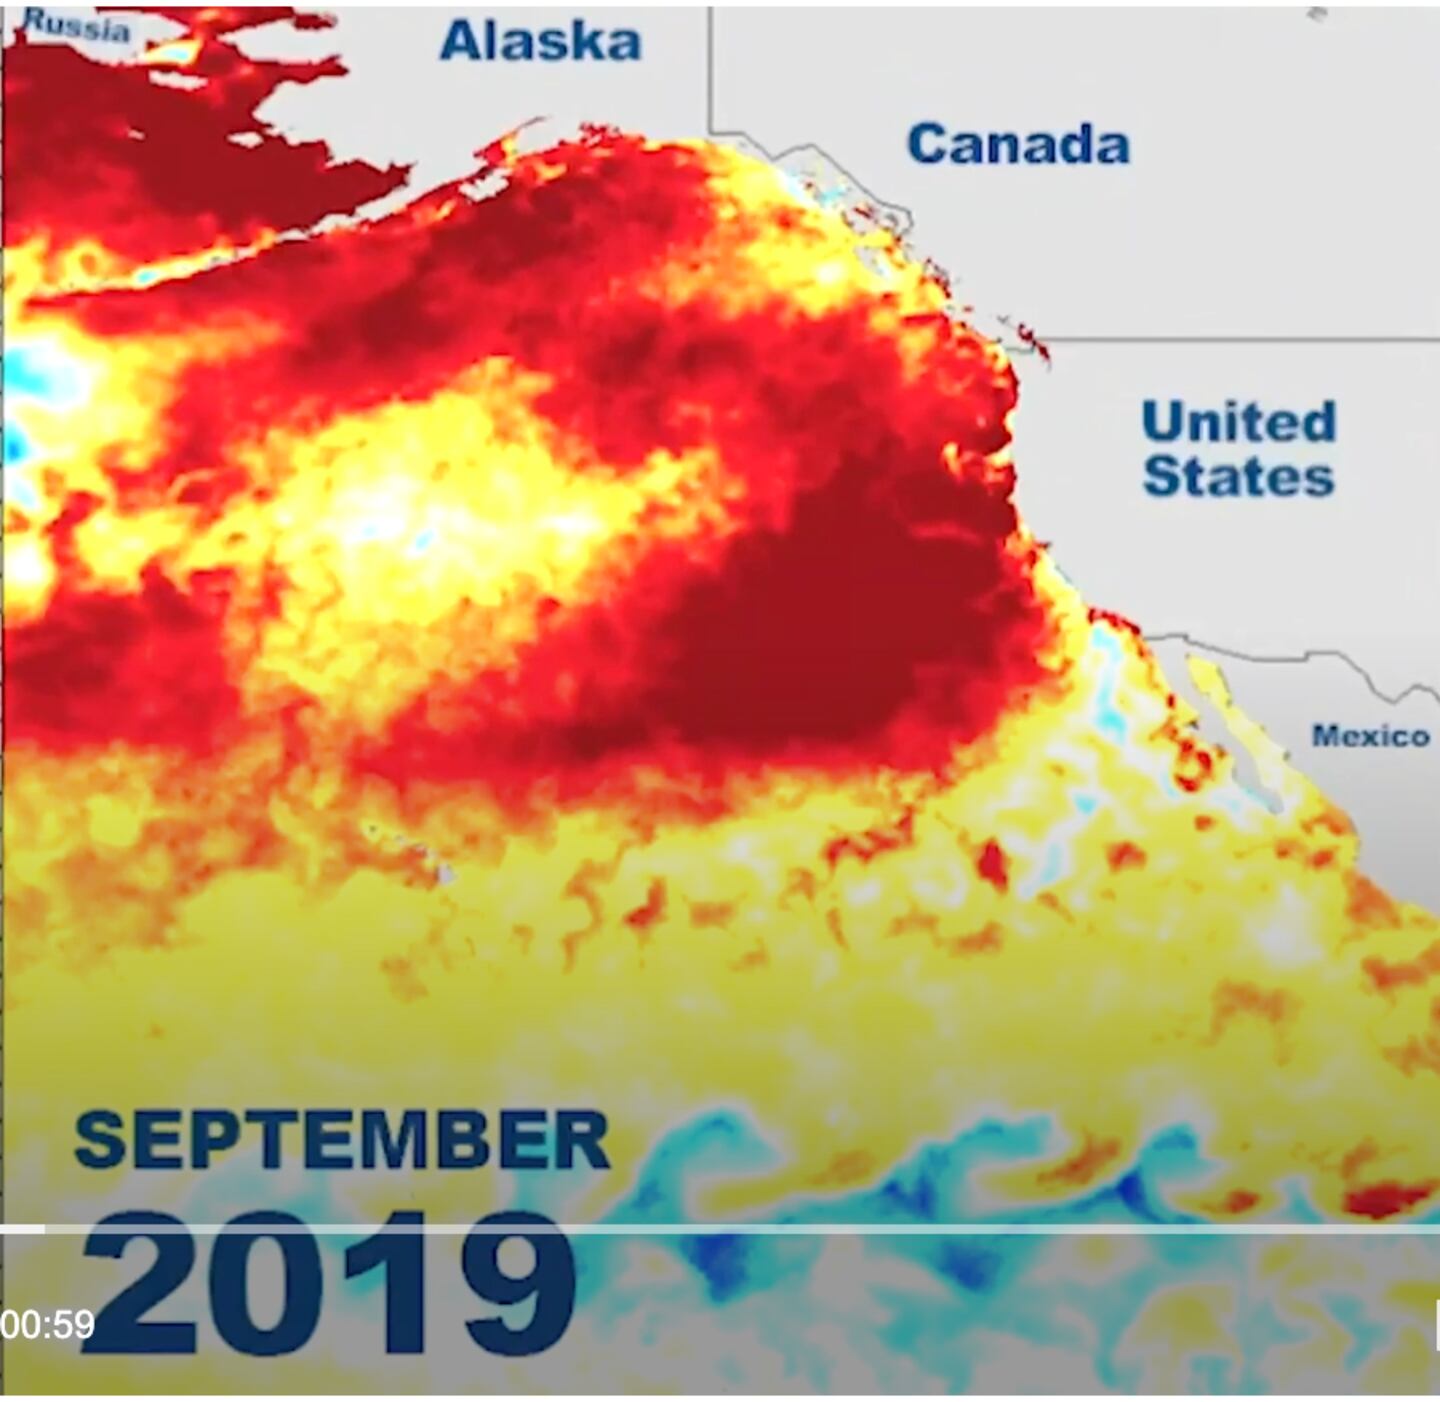

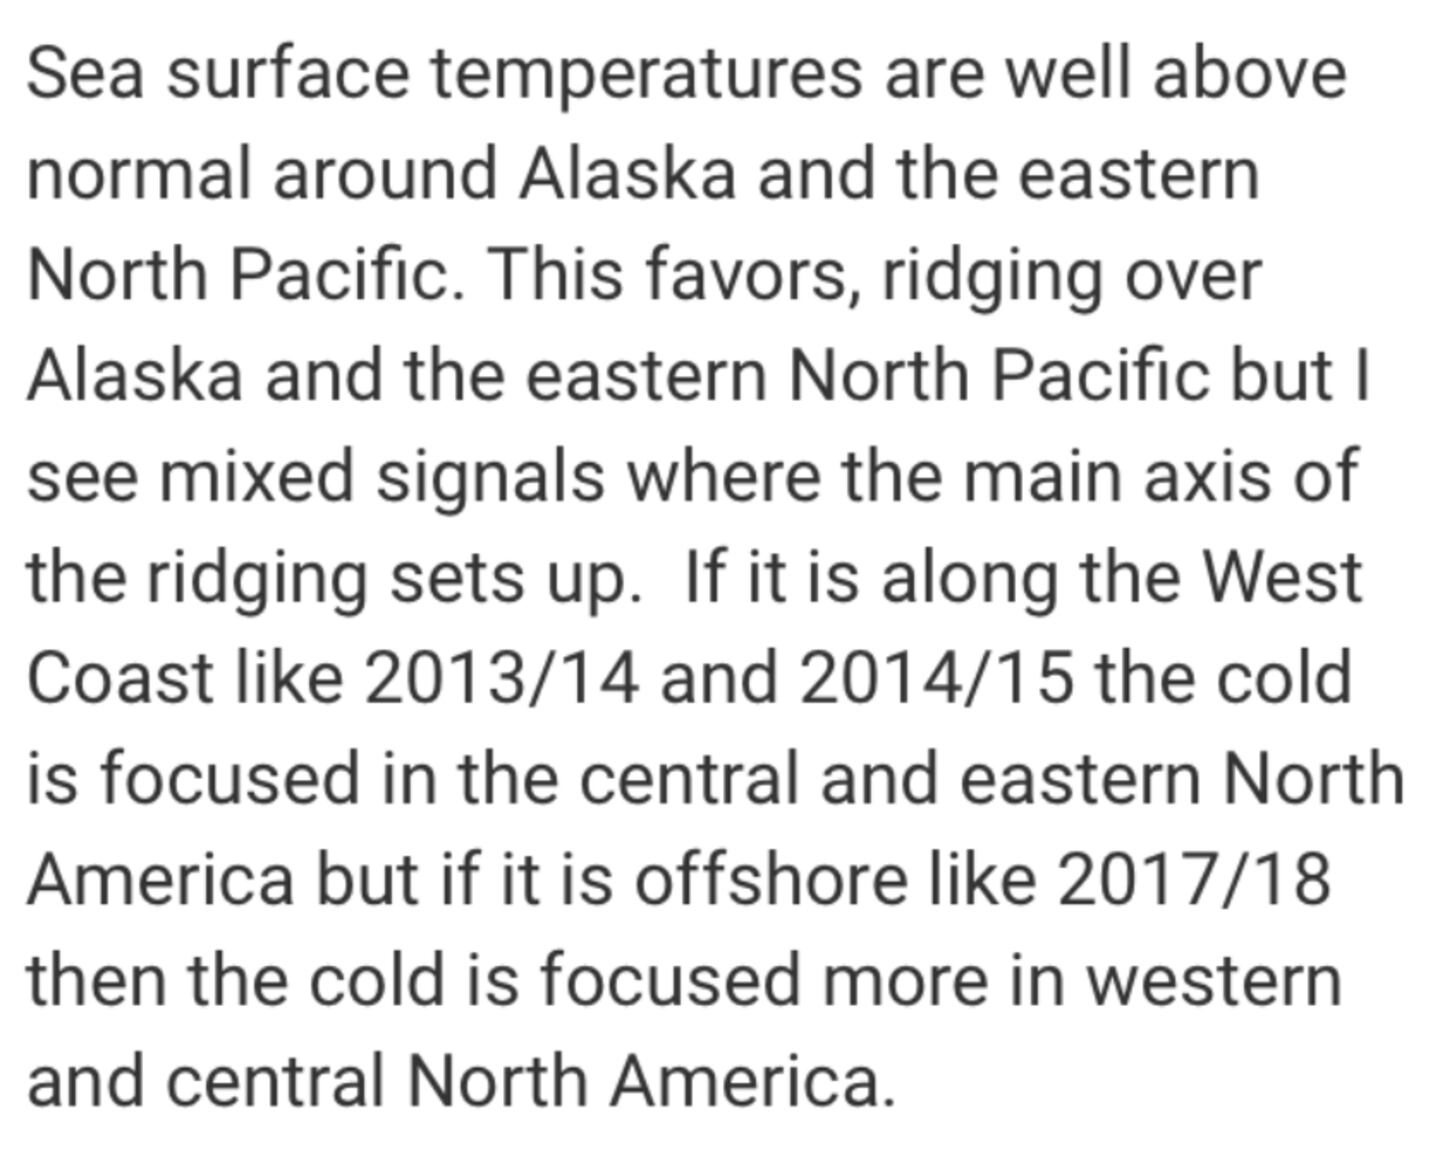
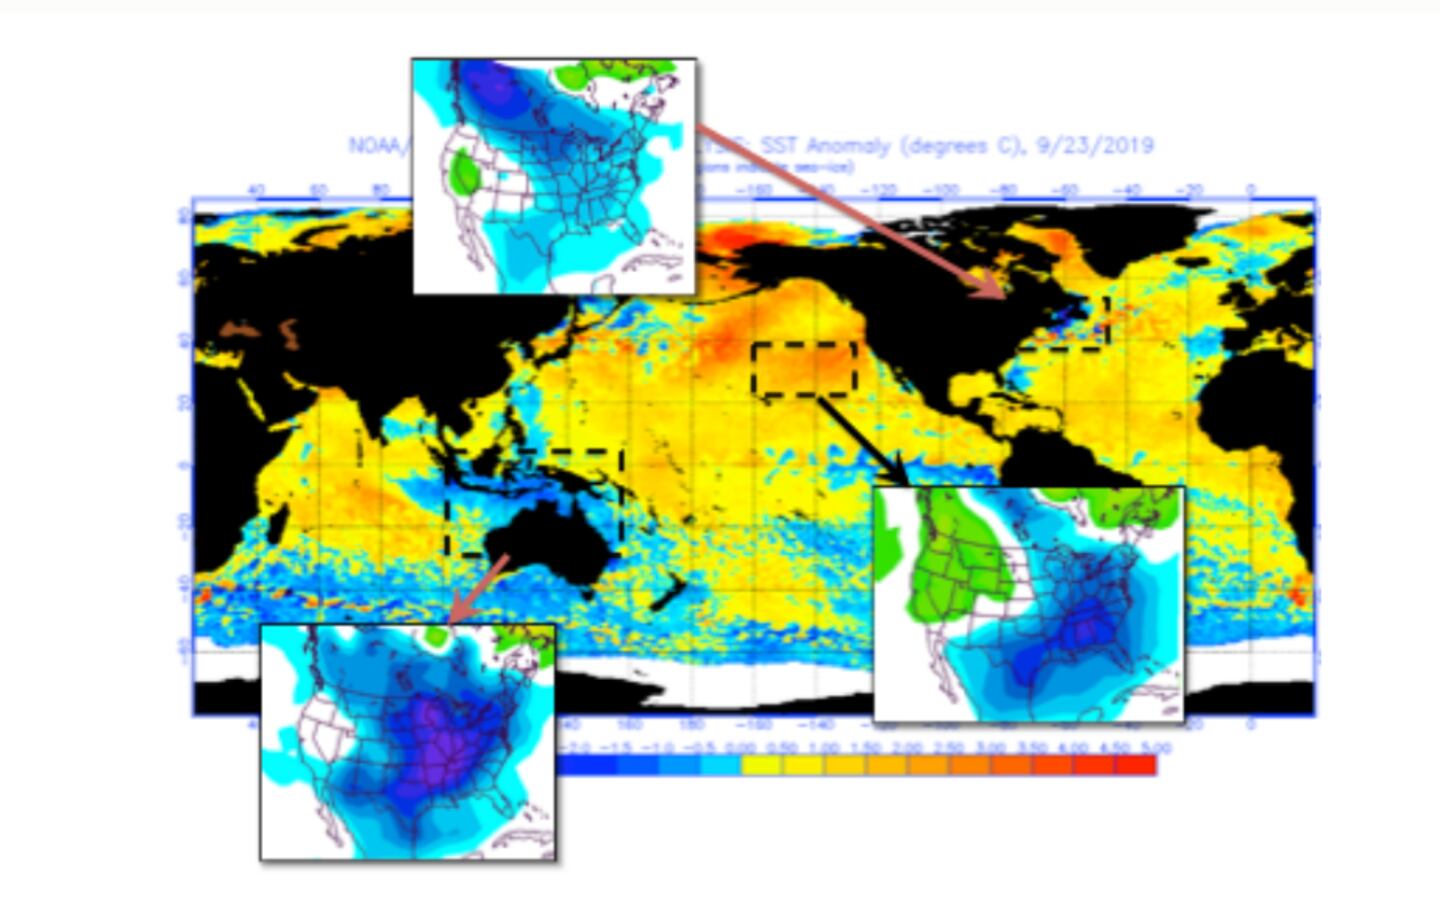
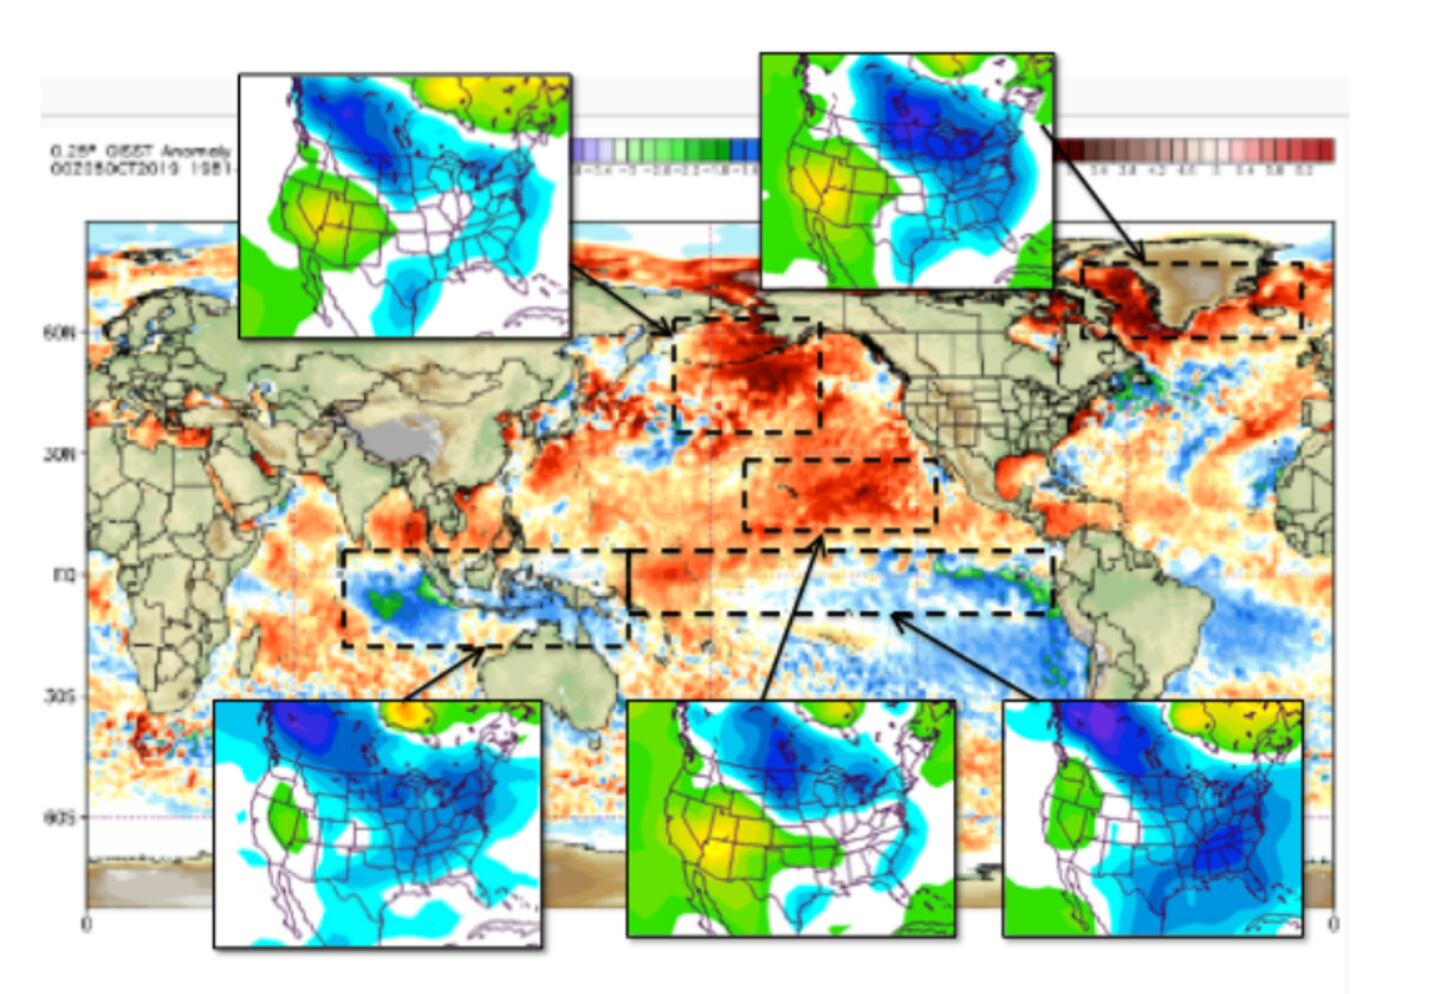
Oceanic SSTA teleconnections (warm and cold pools) WxBell/Weathermodels graphics:
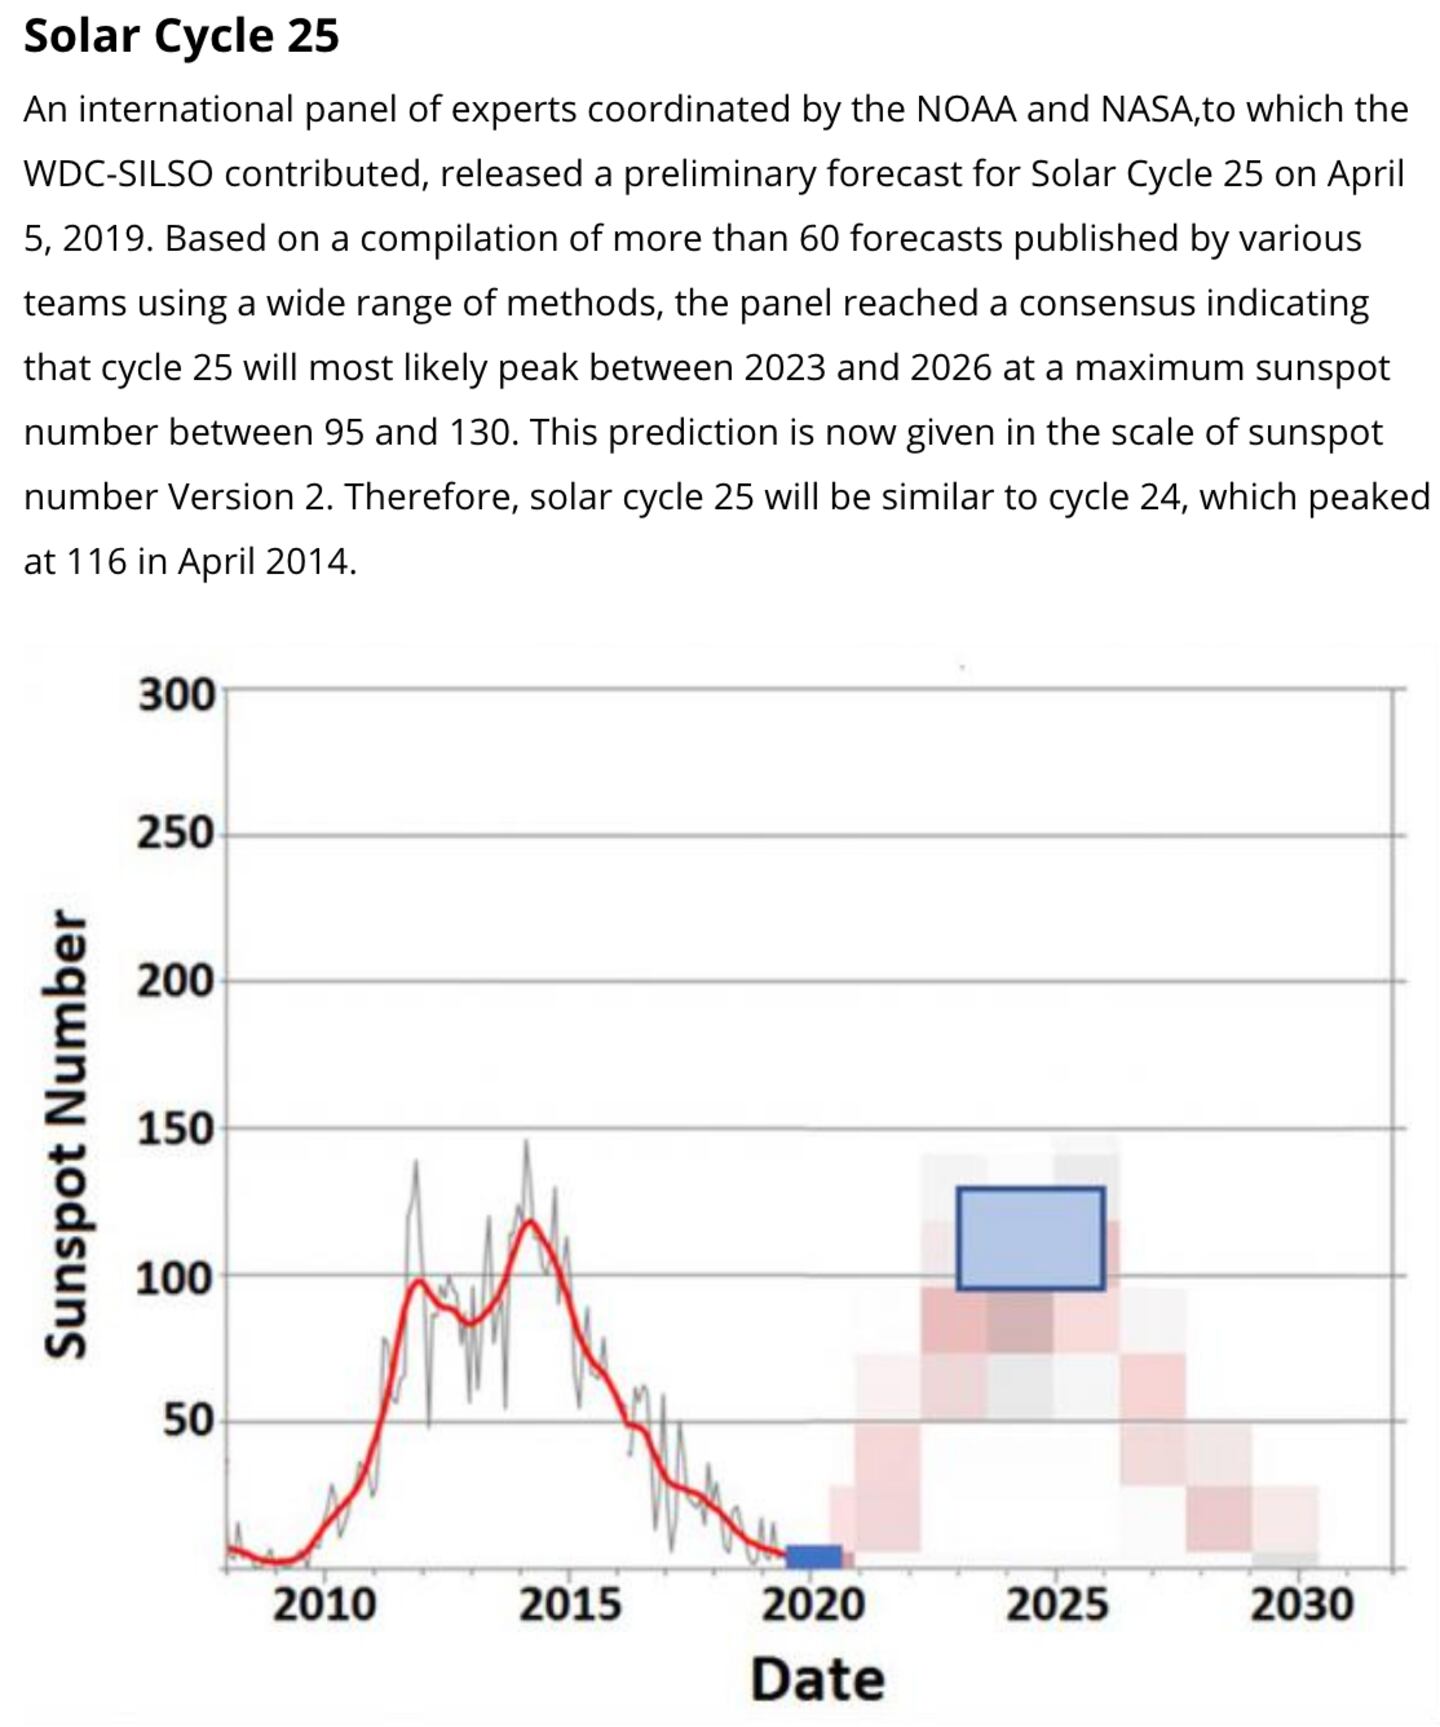
The previous SOLAR MINIMUM occurred in December of 2008, the last SOLAR MAX occurred in April of 2014.
SOLAR CYCLE DATA:
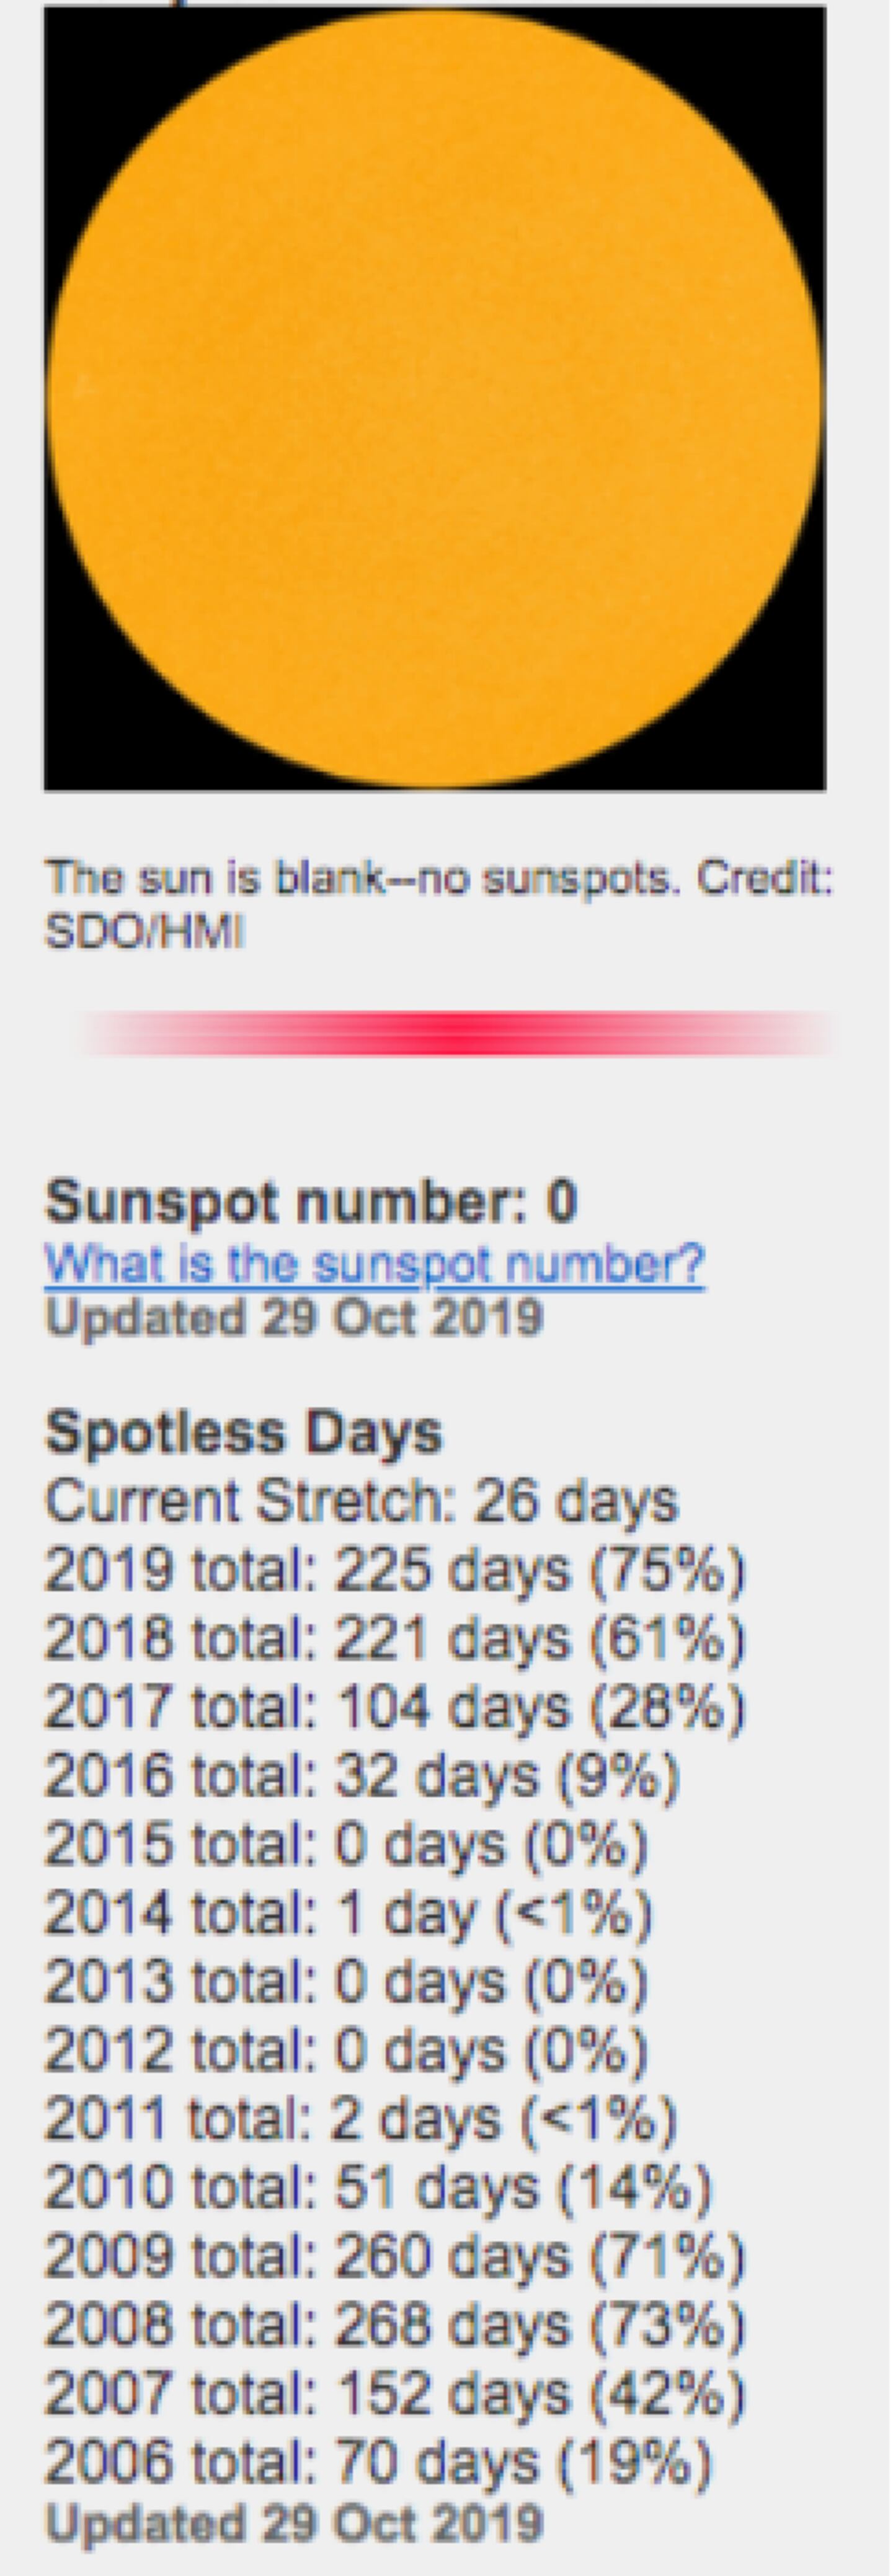
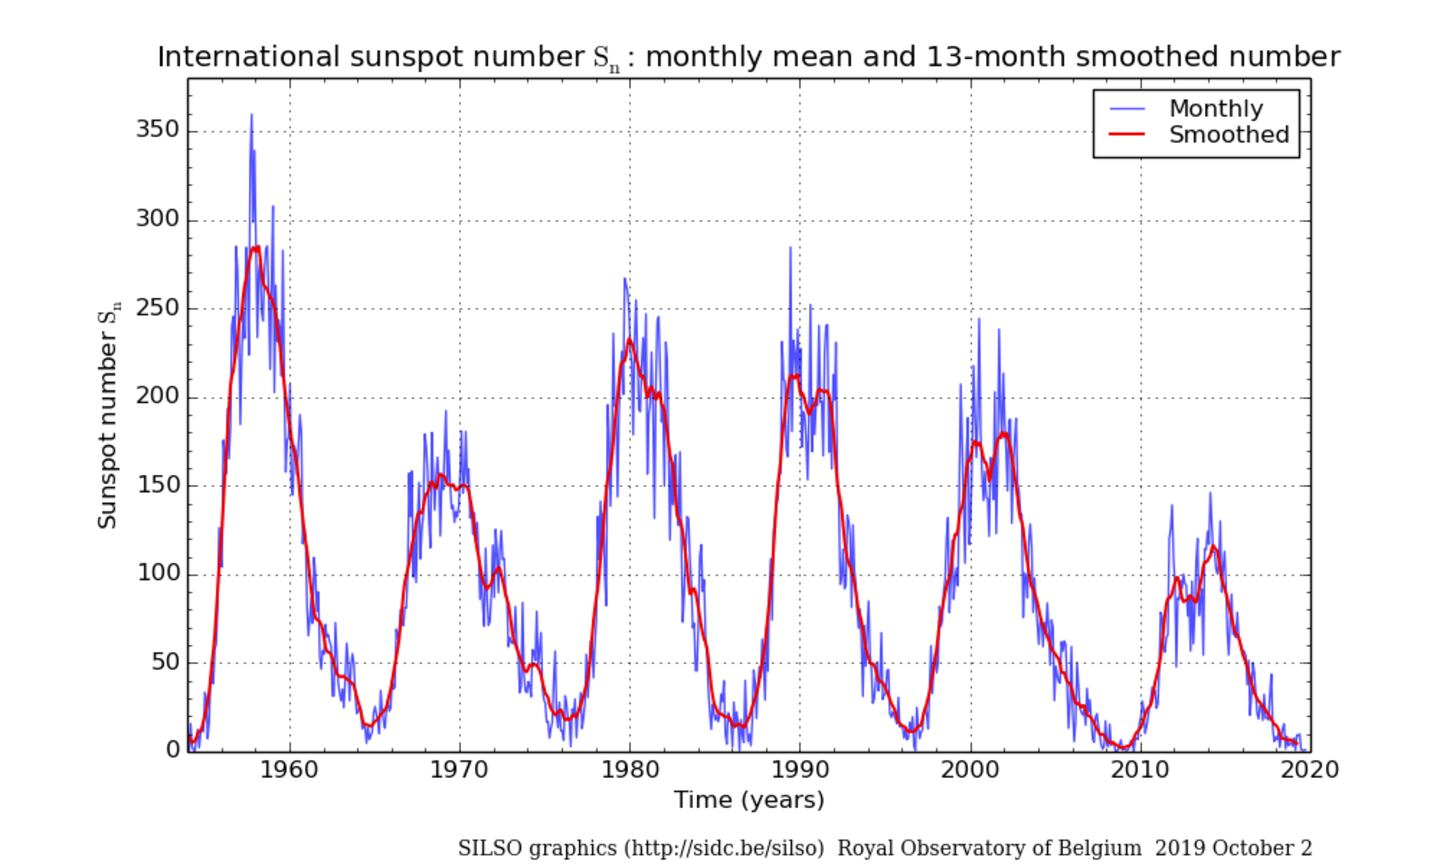
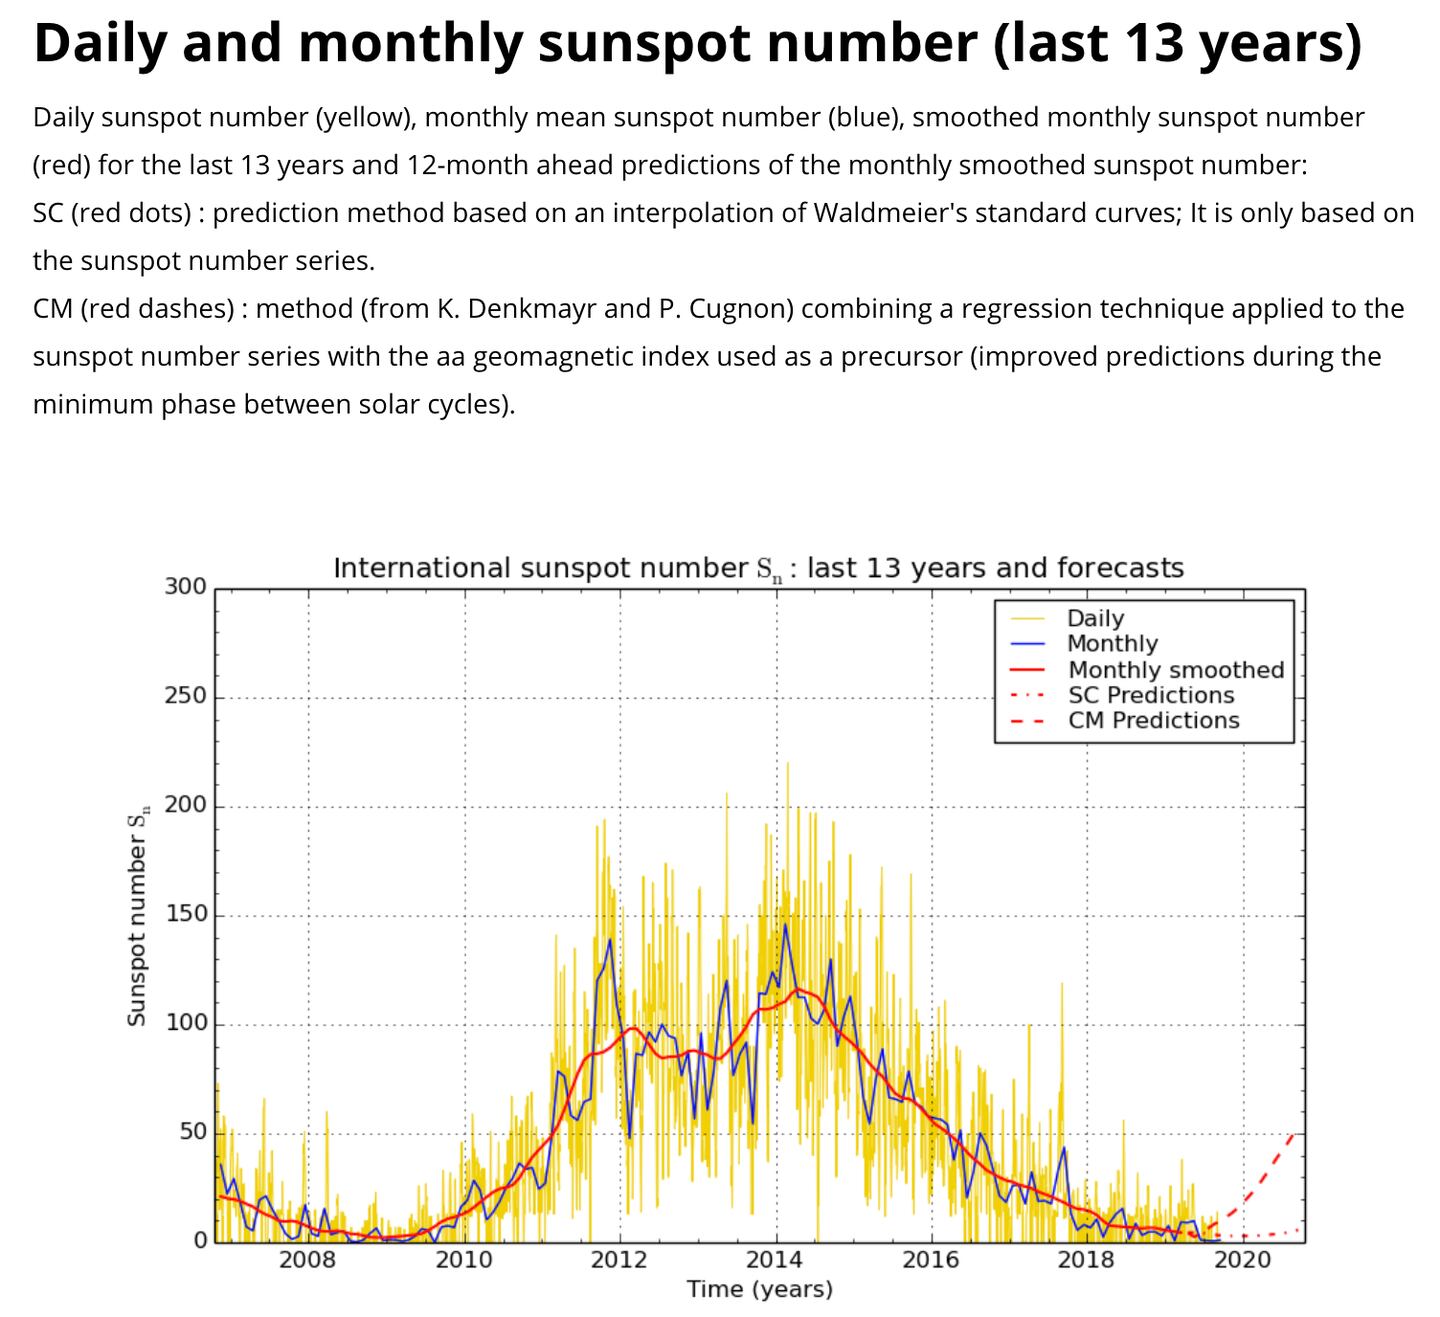
SILSO data/graphics Royal Observatory of Belgium, Brussels.
We had low solar in 2008/09 and last winter 2018-19 and yet two of the three winters were warm in much of the country. There is not a one to one correlation as many mistakenly believe.
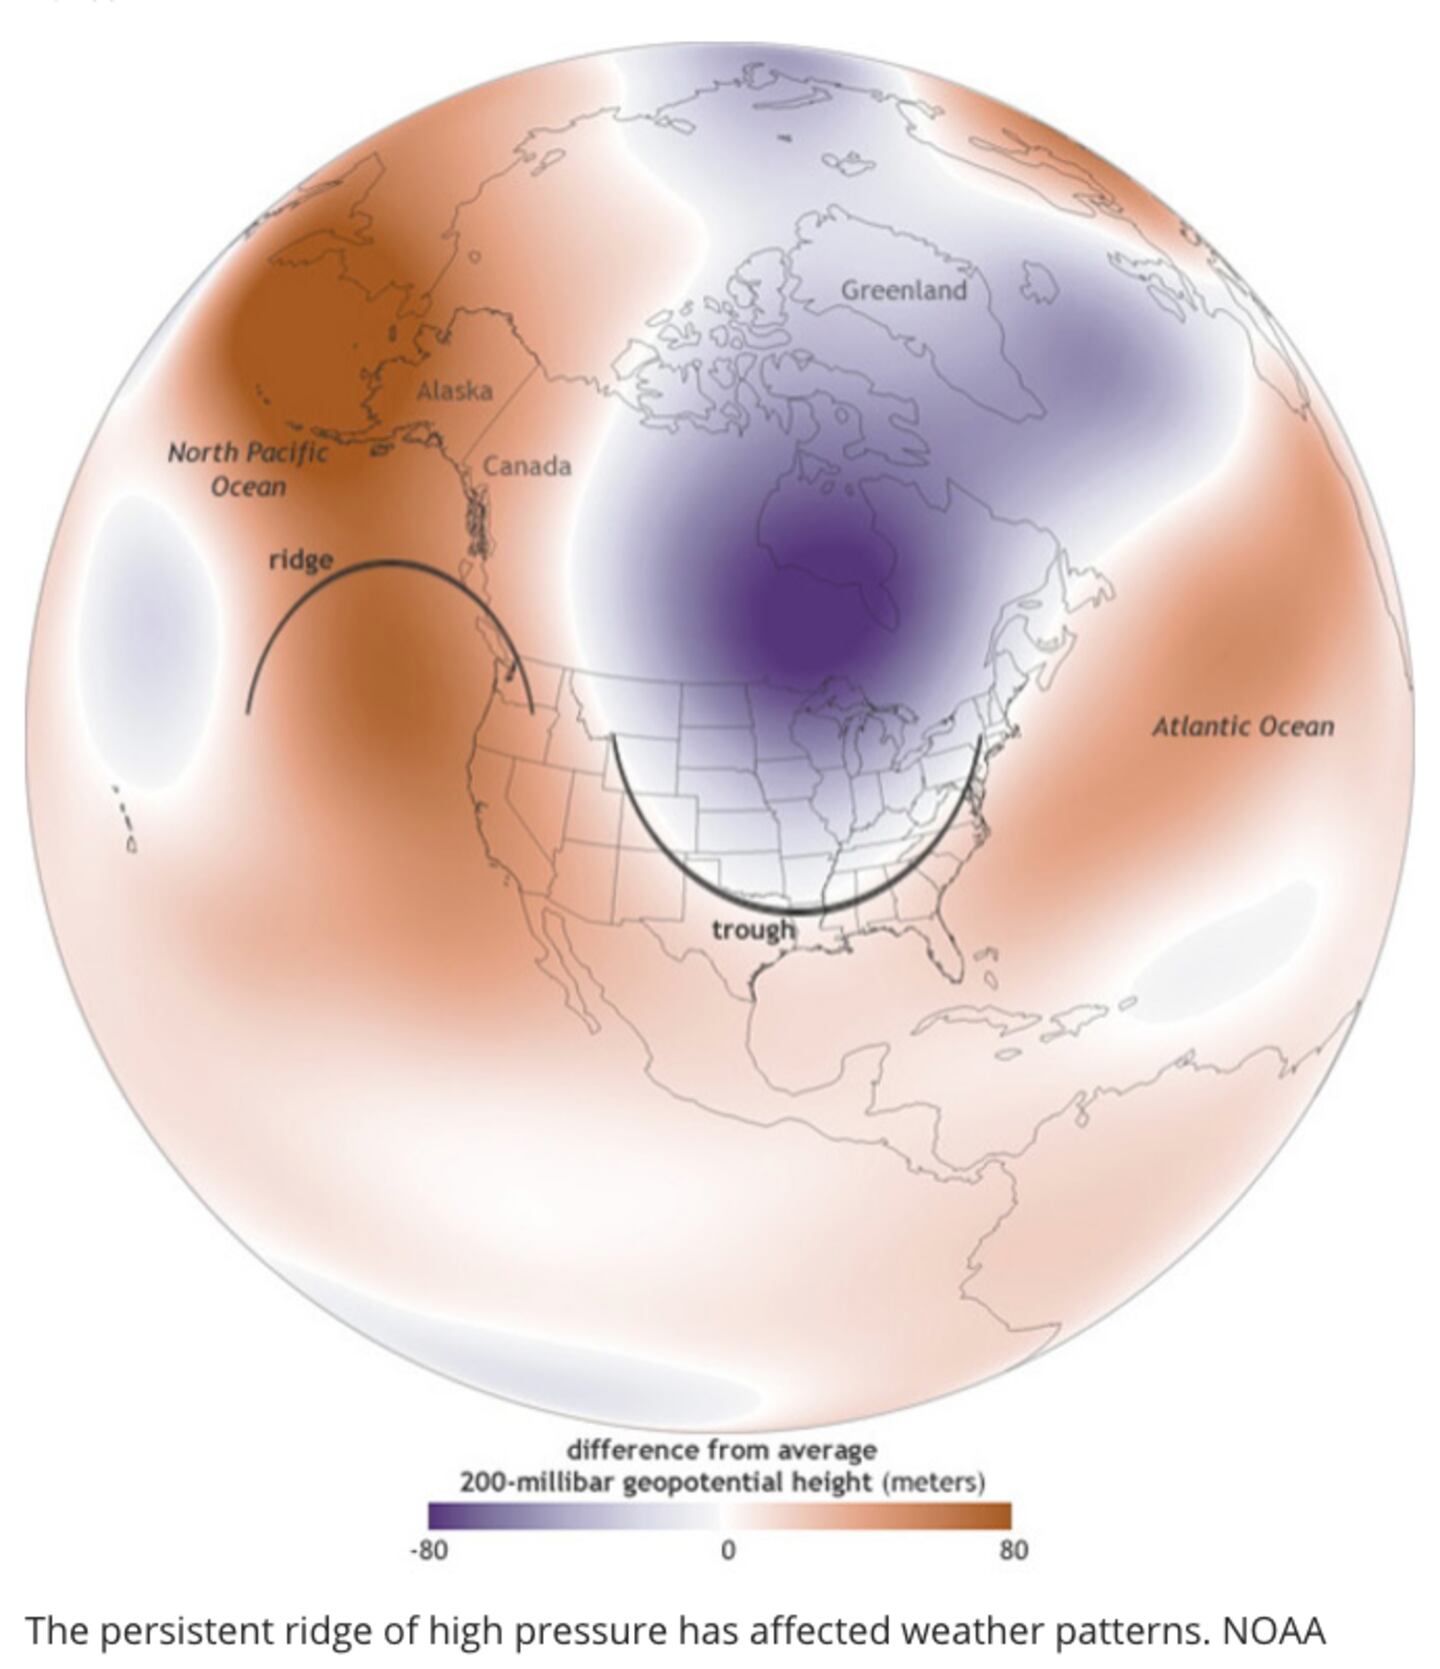
Next looking at a combination of Westerly +QBO with a near-neutral ENSO and a Solar Minimum this winter:
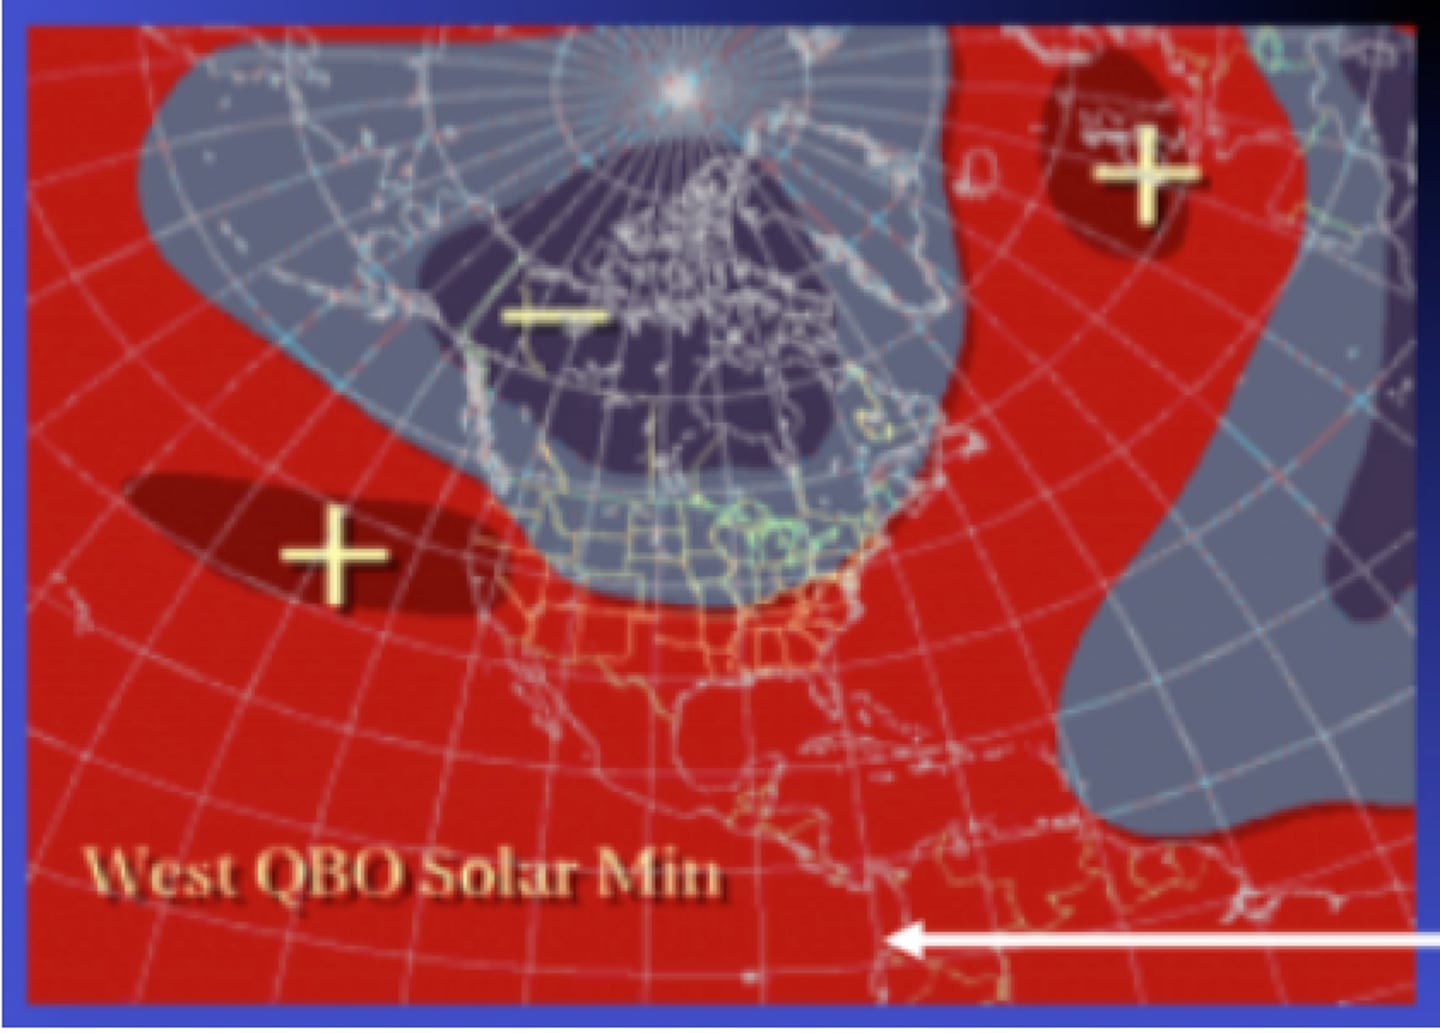
Mid level jet stream heights shown above + = ridge - = trough (above or below average) and resulting temperature pattern shown below, a combination between these two:
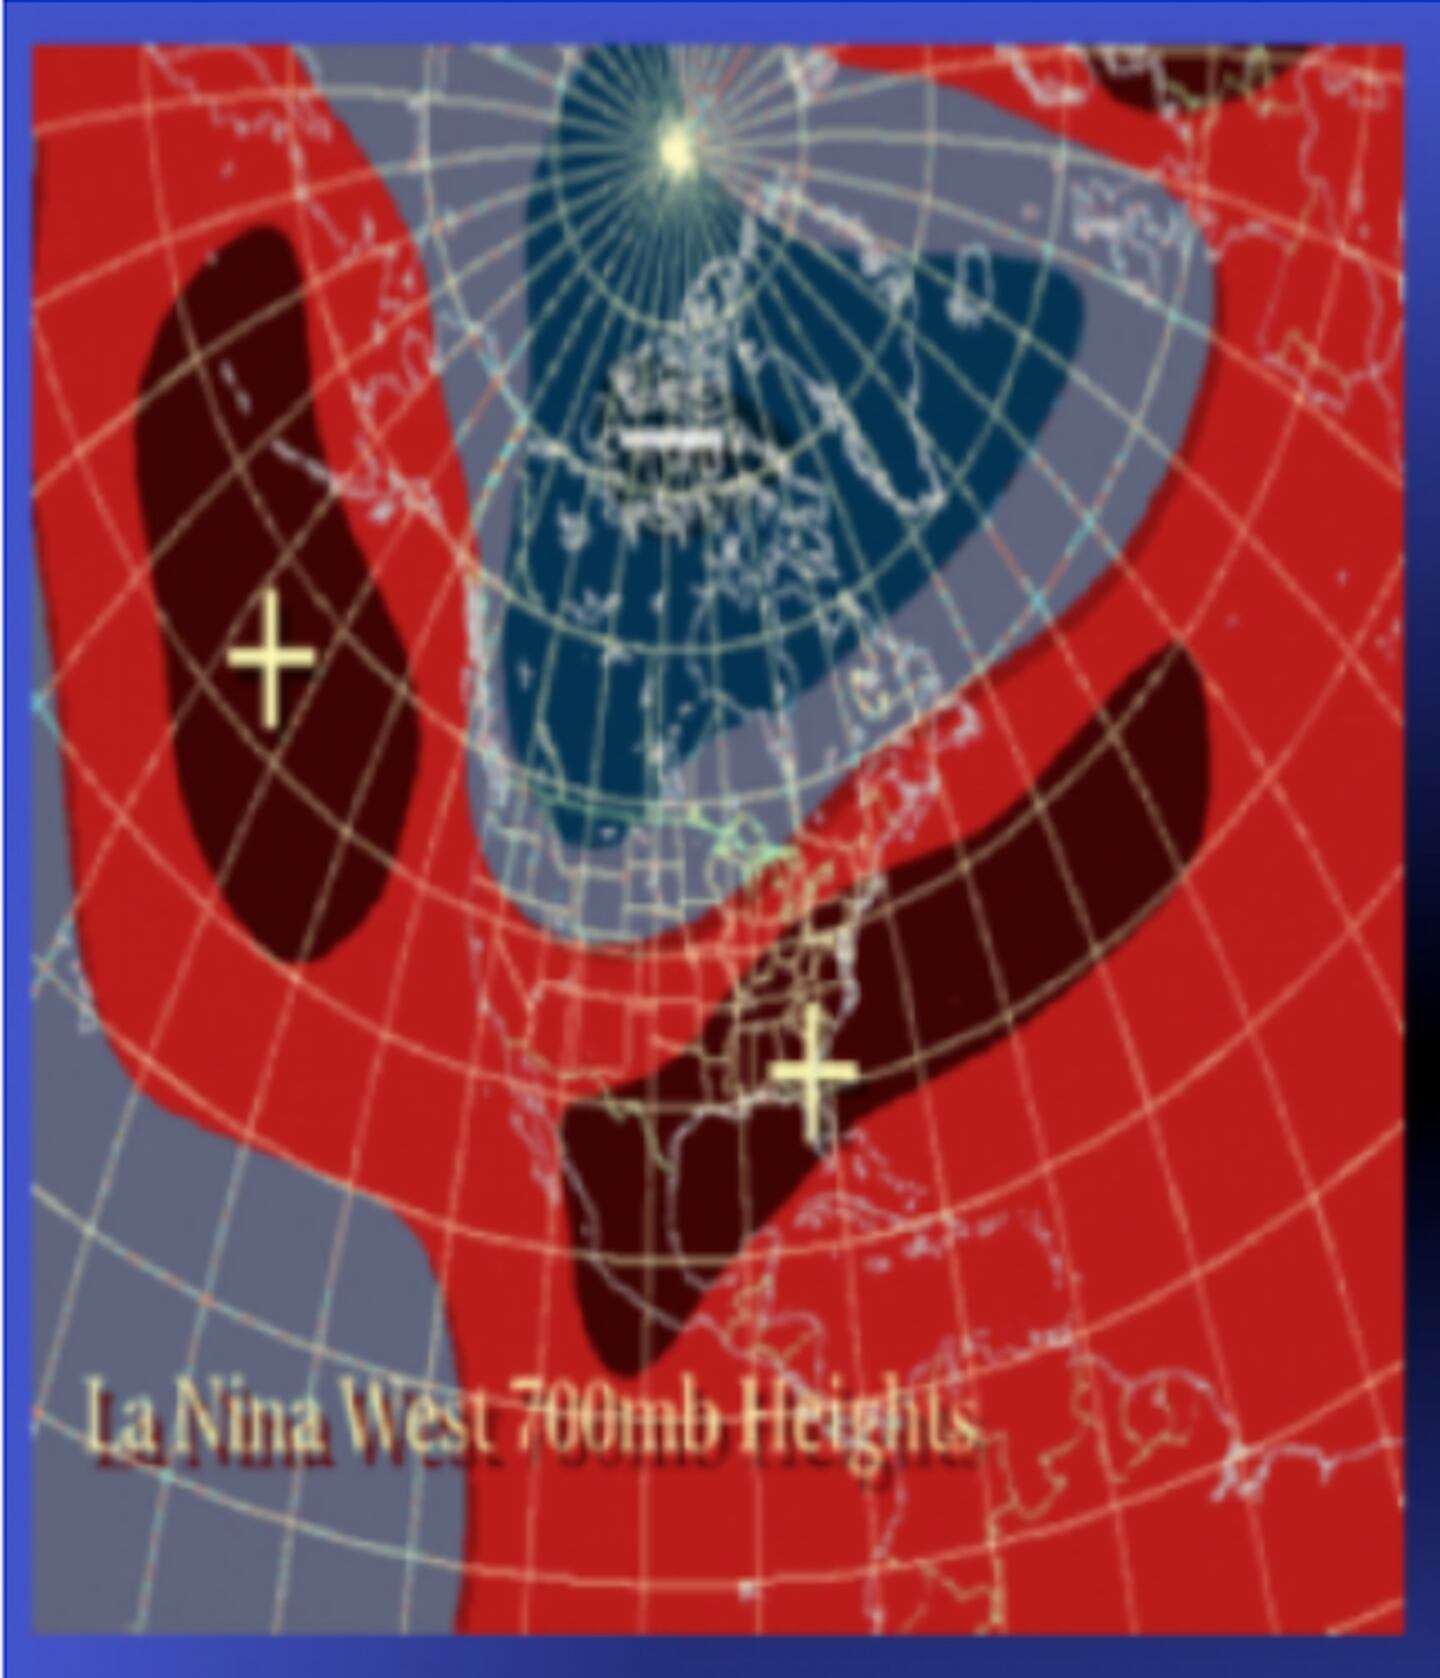
On the other hand, IF a La Nina or cool ENSO situation arrises in the months ahead and the QBO stays Westerly (+) the odds for a Southeast ridge and mild winter would increase (WxBell graphics, research by Barnston .et .al):
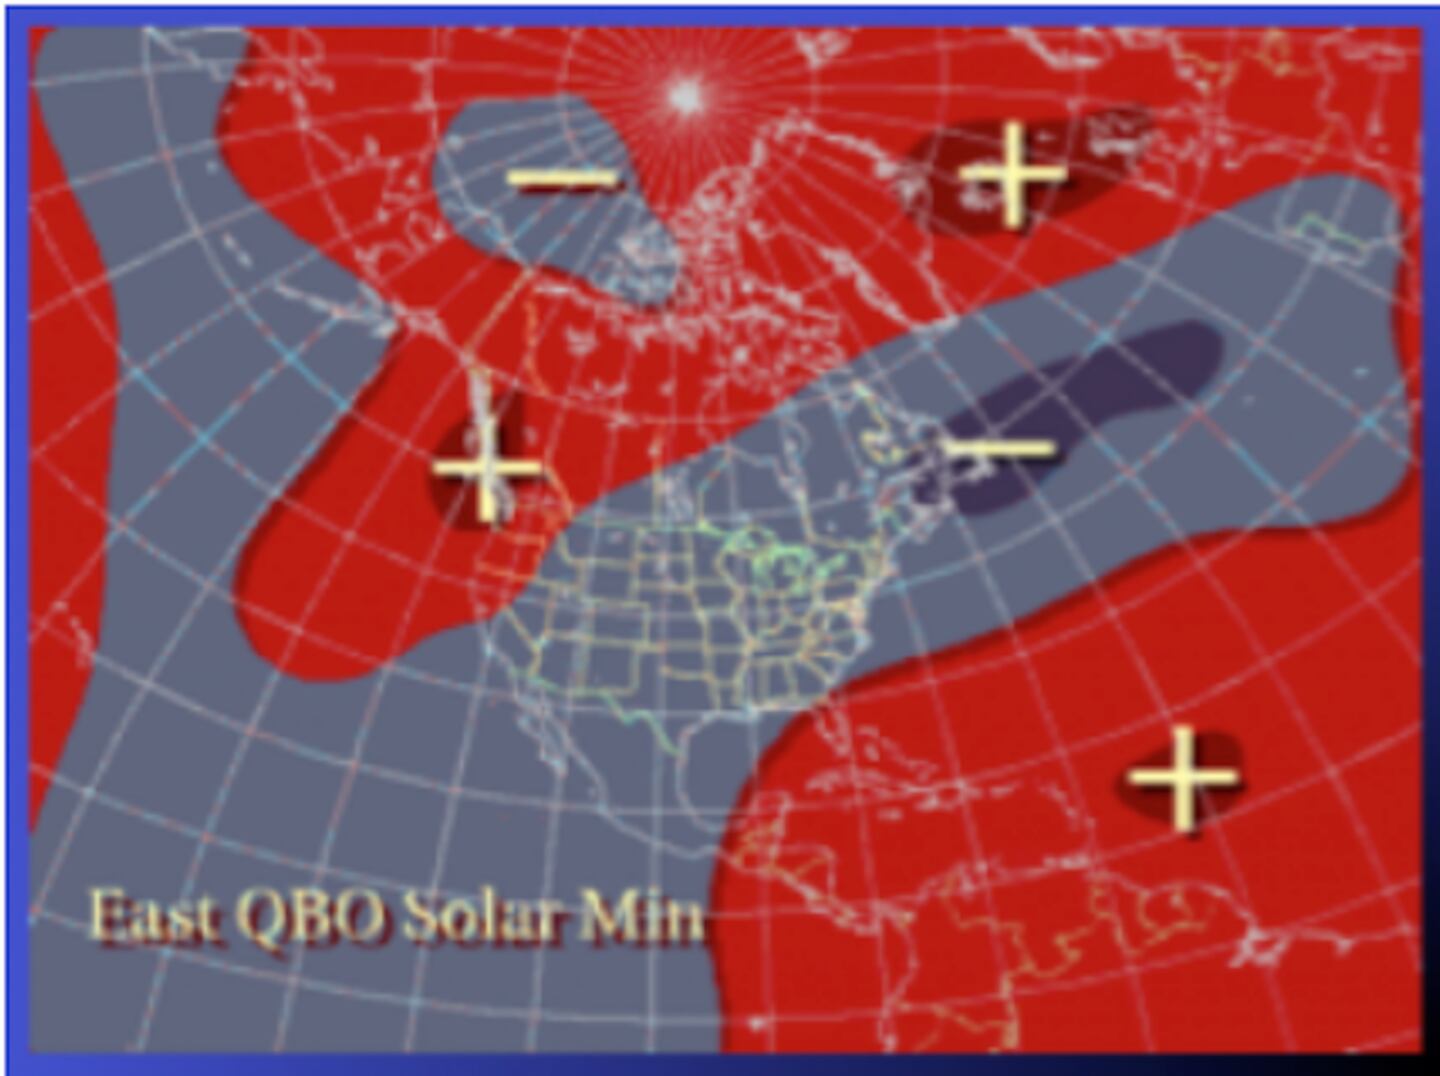
On the other hand if the QBO switches to Easterly or a negative phase then the odds of colder and stormy increase with a trough over much of the Central and East US with blocking ridges in the + red areas:
The so-called warm blob, El Nino, PDO and the sun are all interrelated.
The global sea-surface temperature anomaly pattern in addition to 2014 has some similarity to 2013 as of now at least.
WINTER 2013:
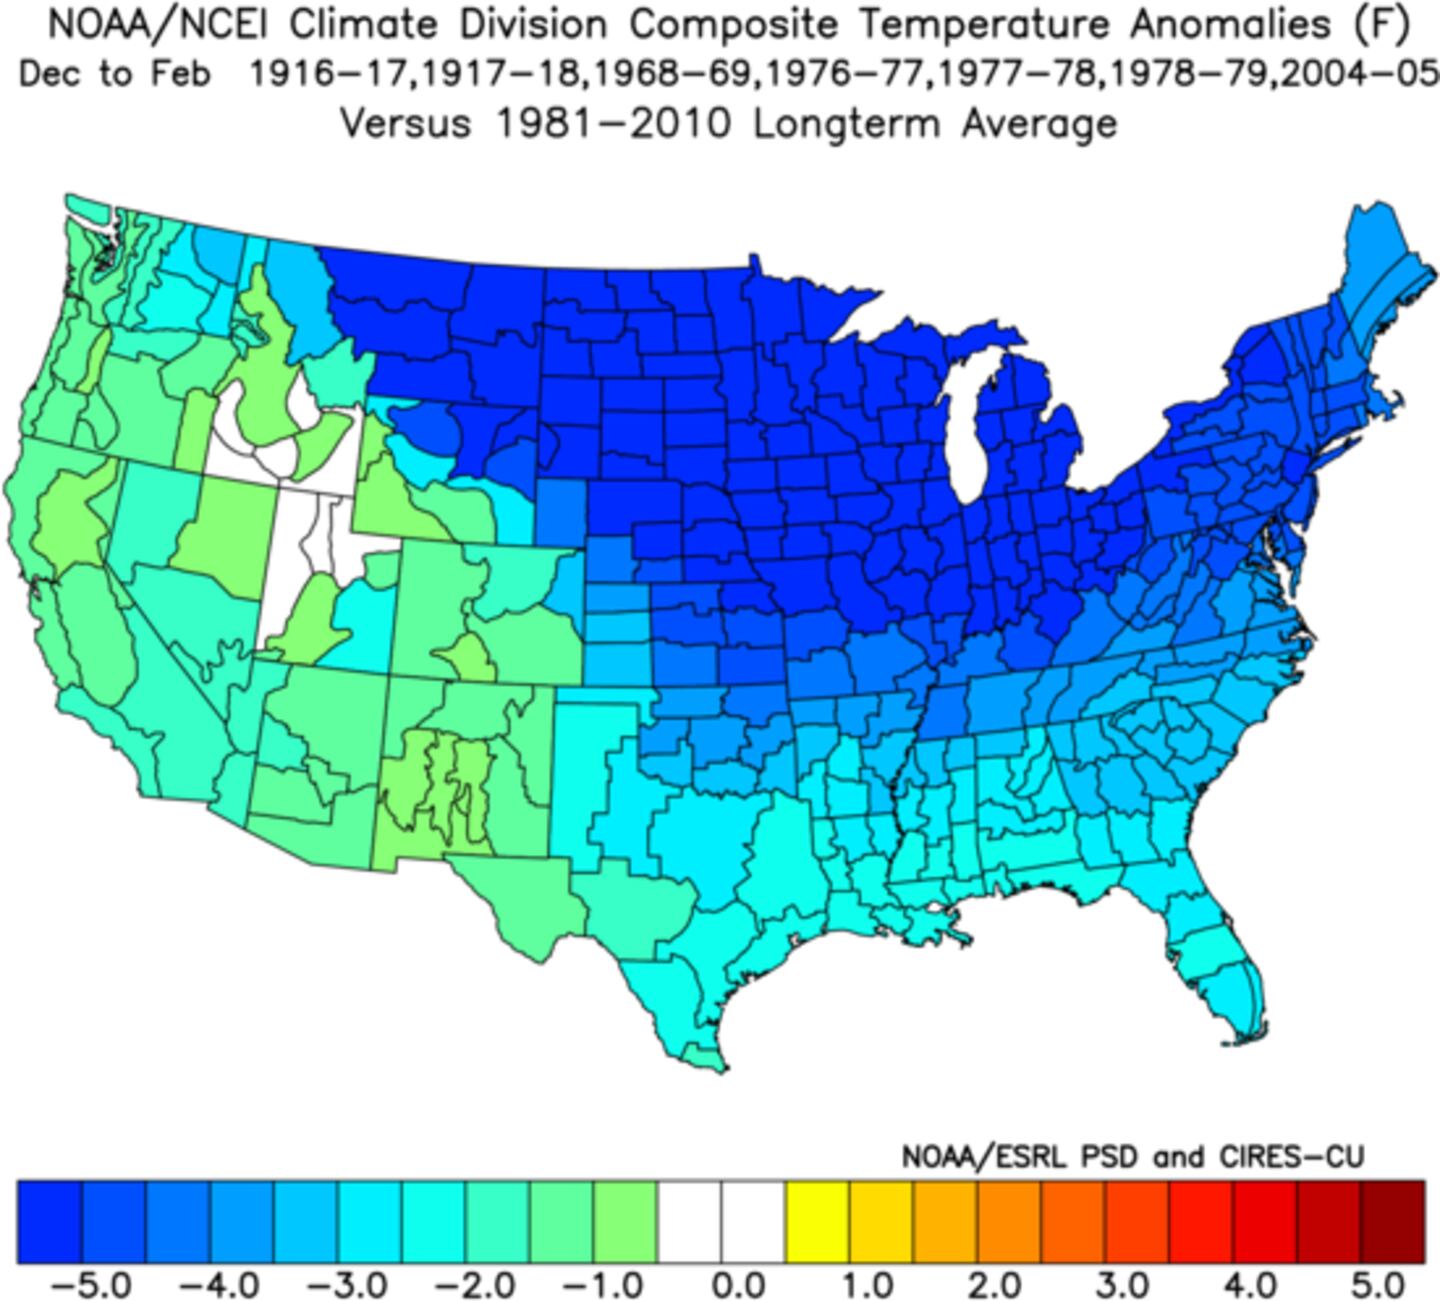
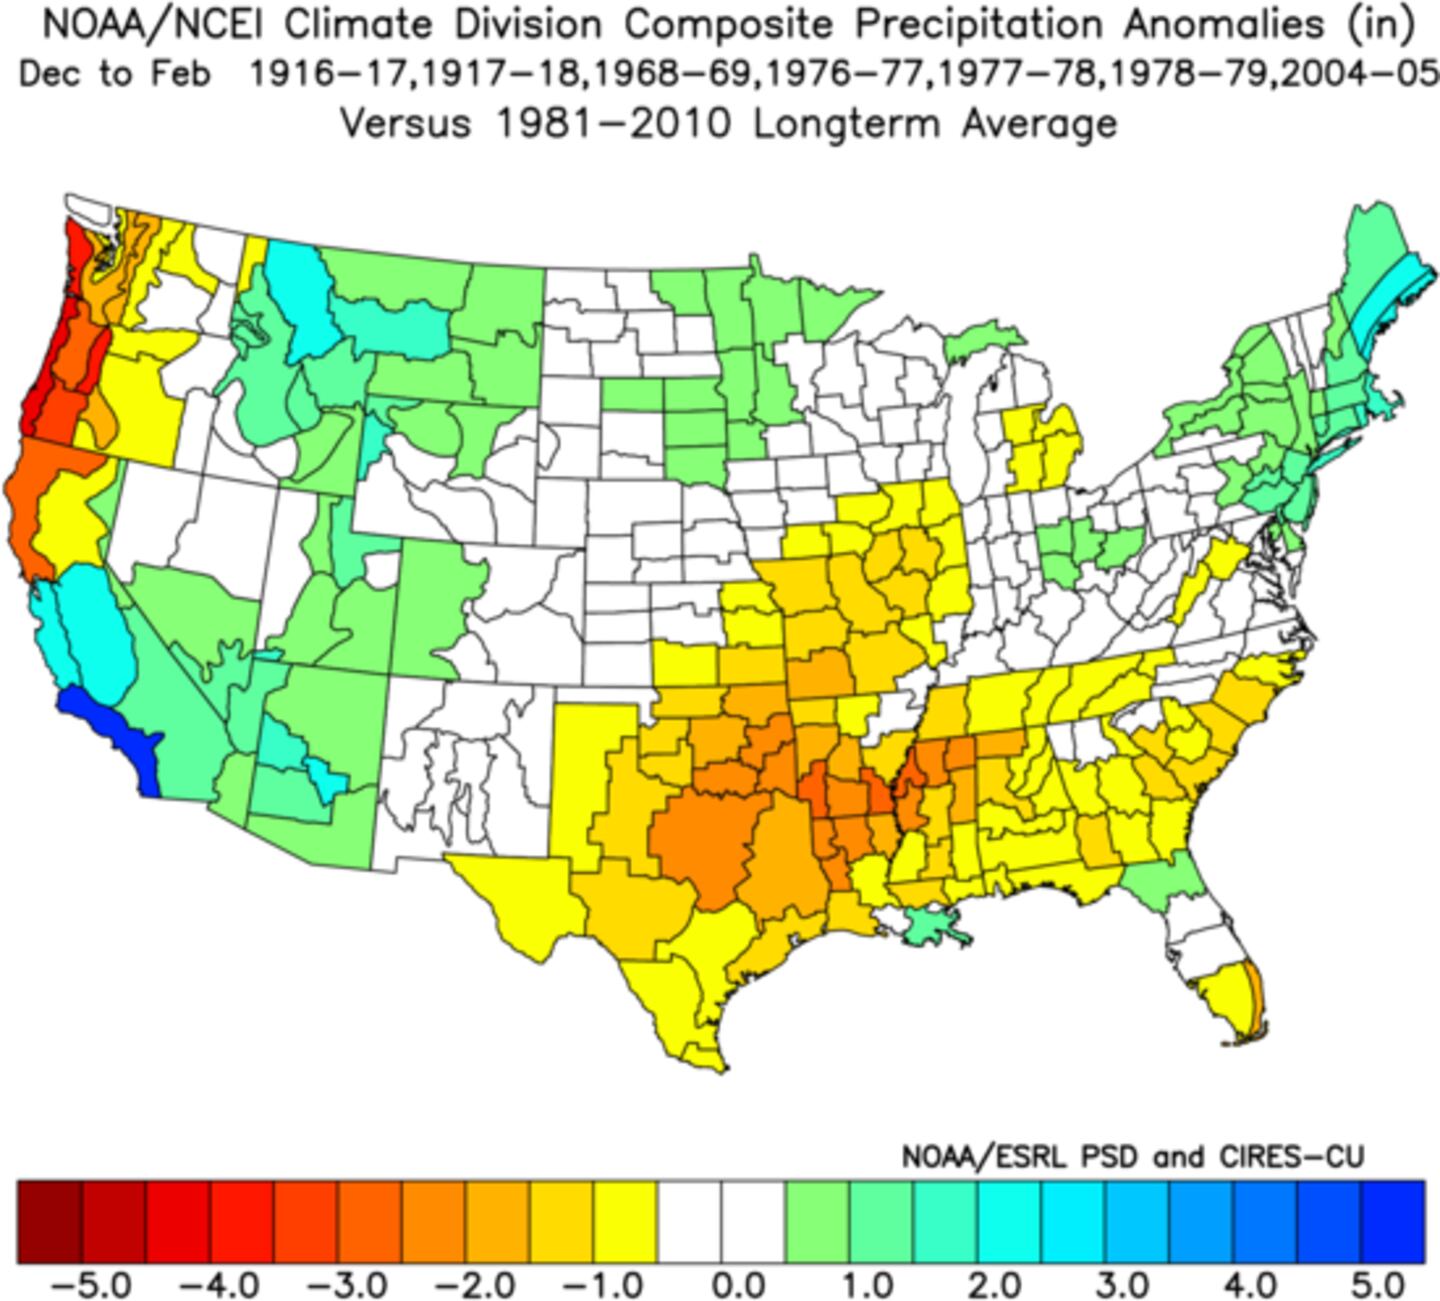
Other past years (analogs) with some semblance to this year on low solar and global SSTAs are 1916, 1917, 1968, 1976, 1977, 1978 and 2004:
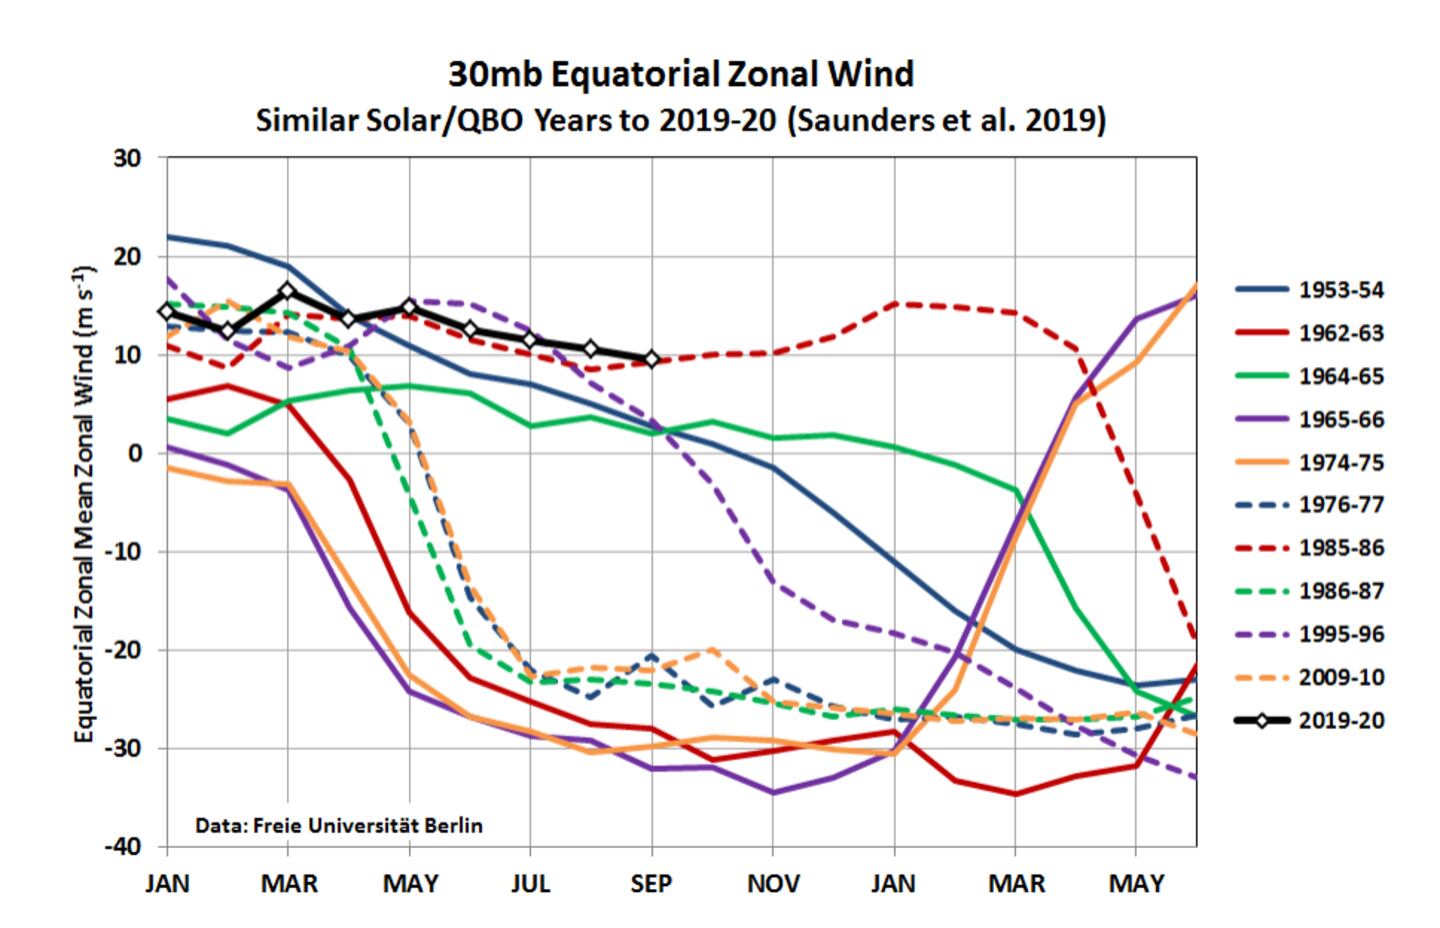
QBO:
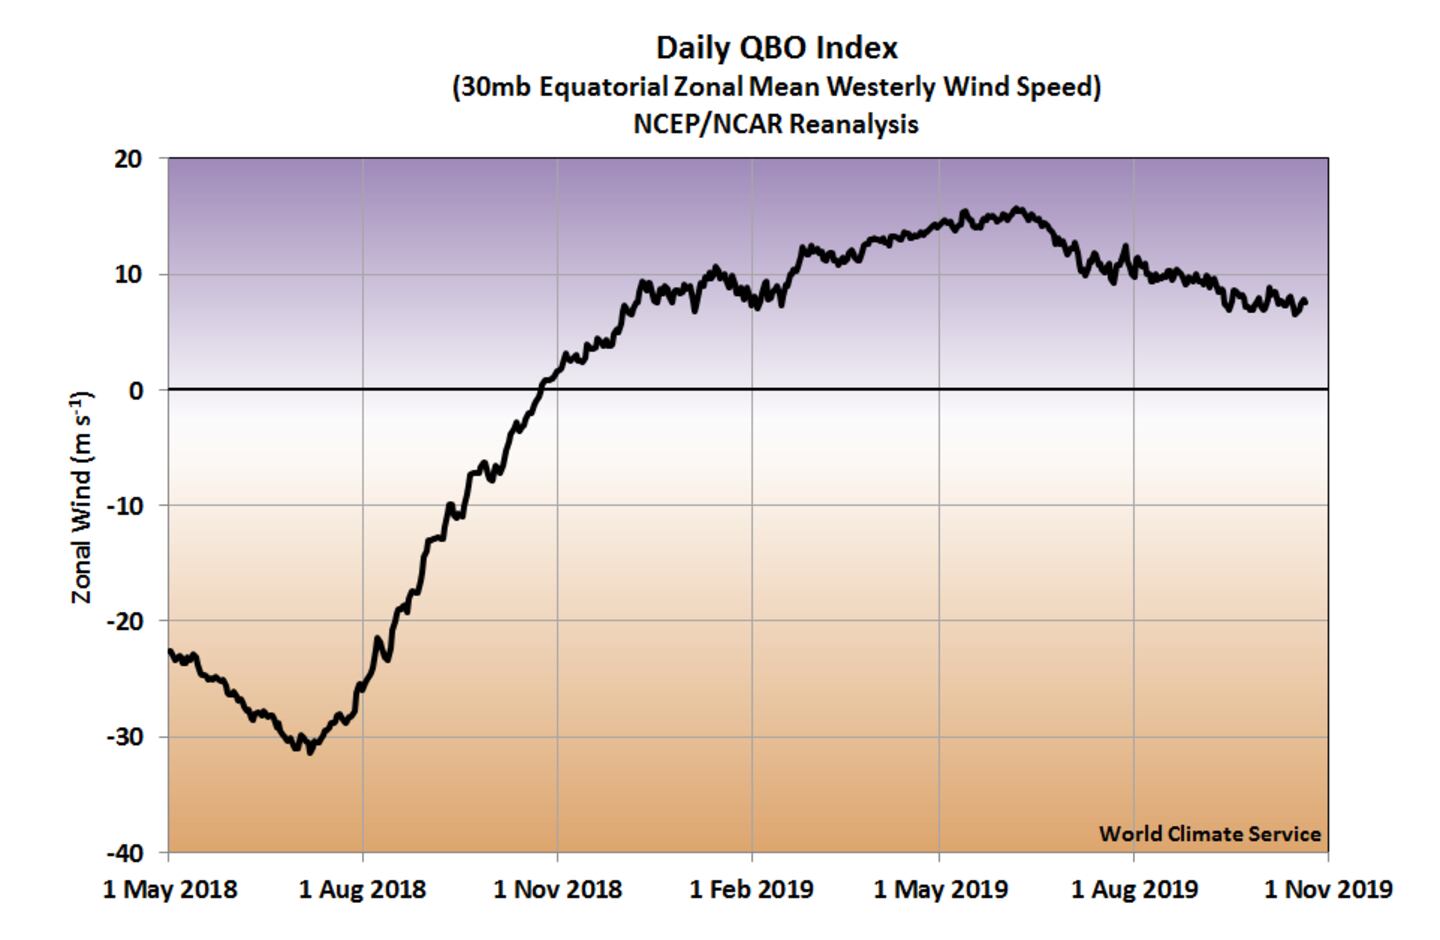
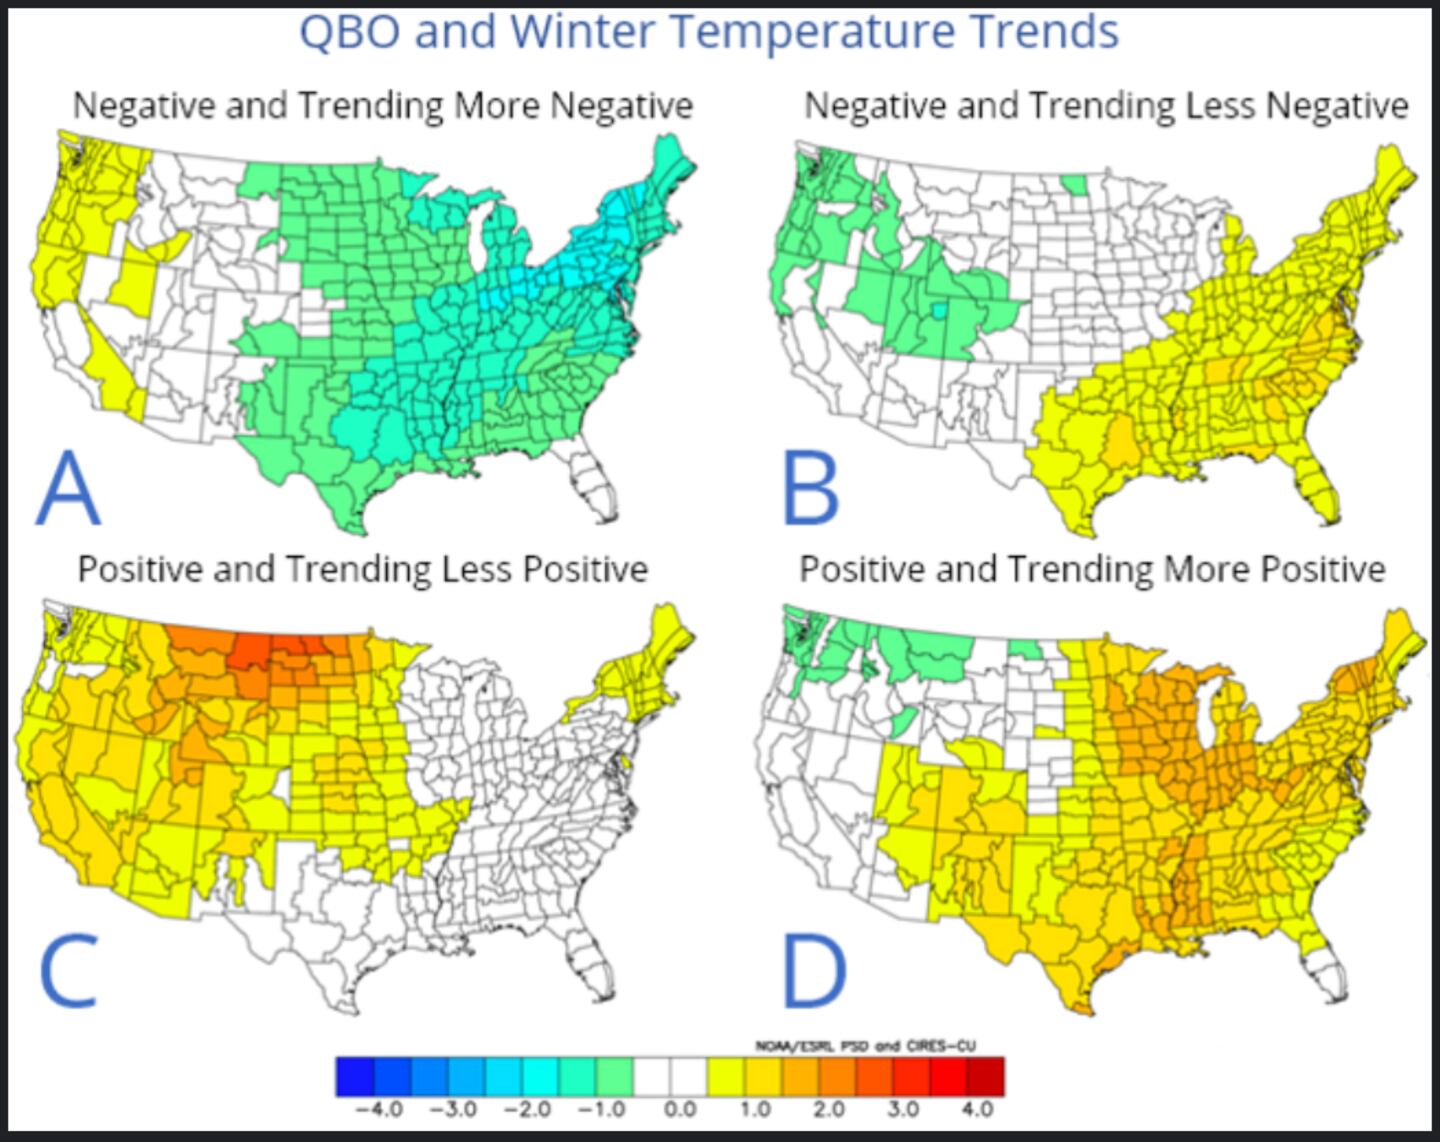
The October QBO is Westerly around +7.6 so this winter is currently looking closest to C above as of now.
So you can see, as is typically the case in weather forecasting, there are conflicting/contradictory indicators.
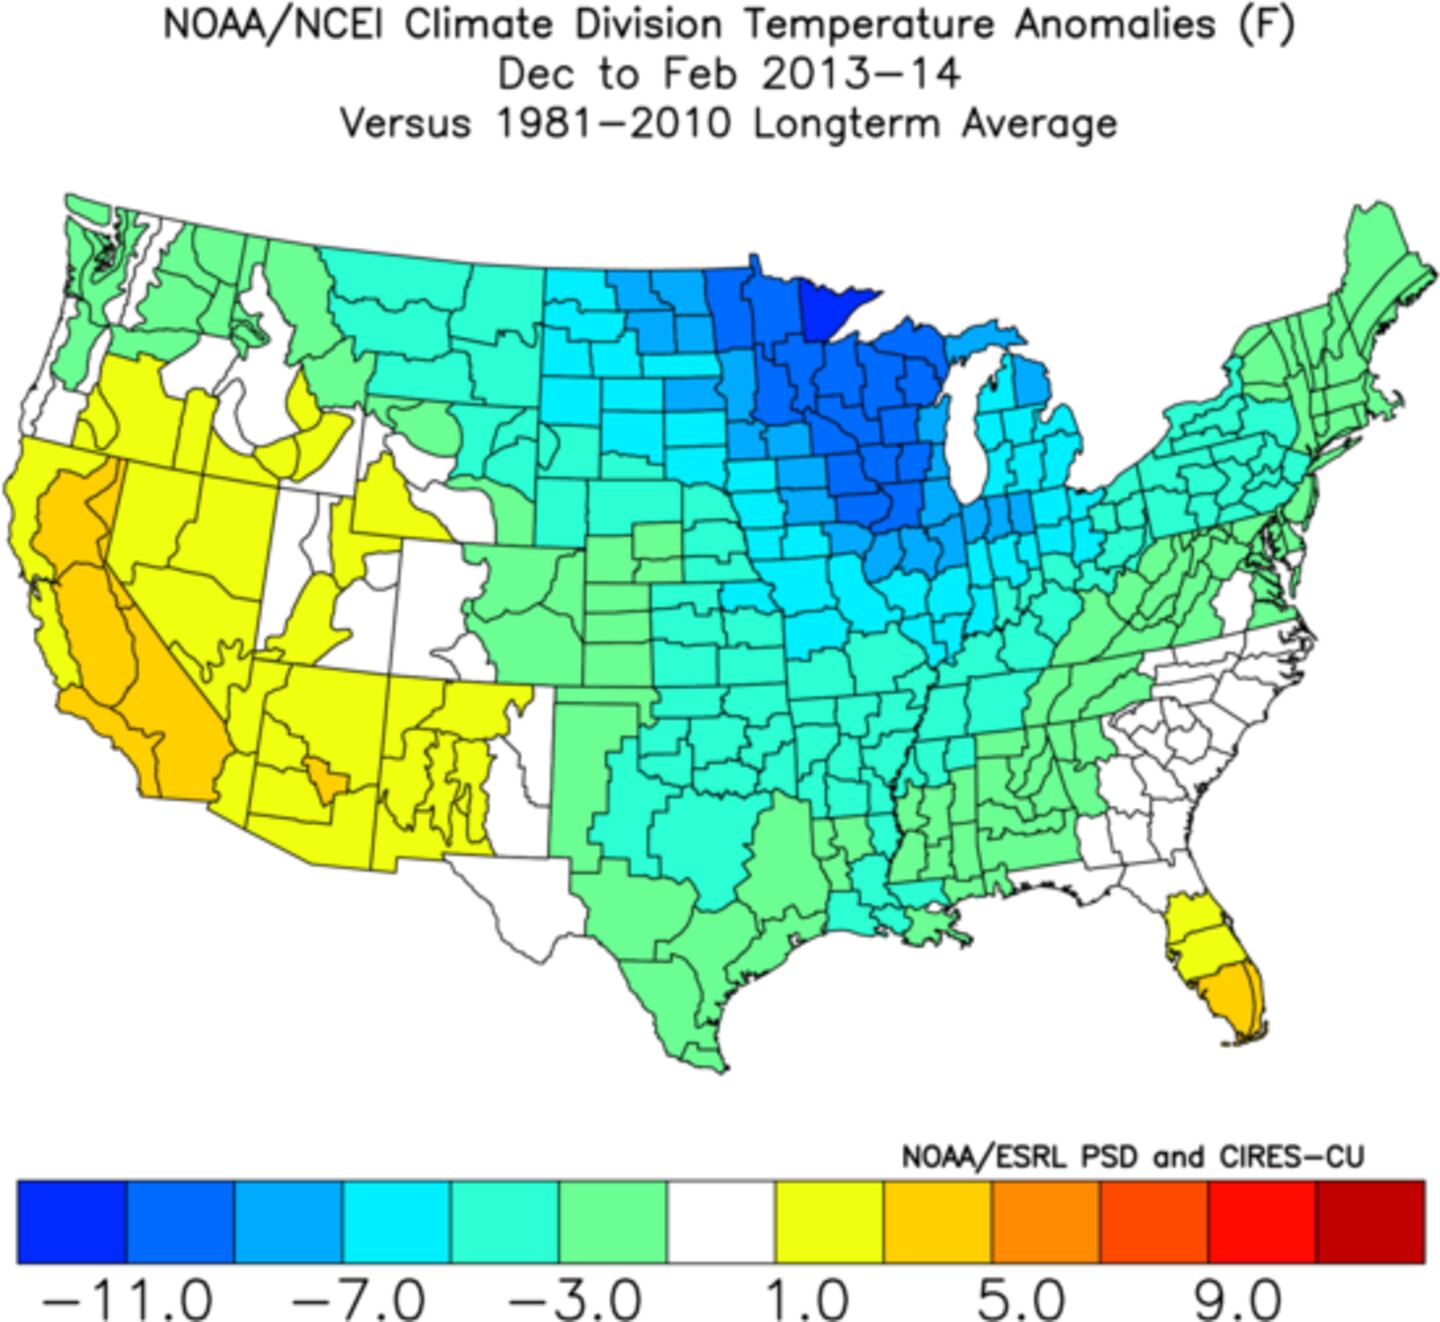
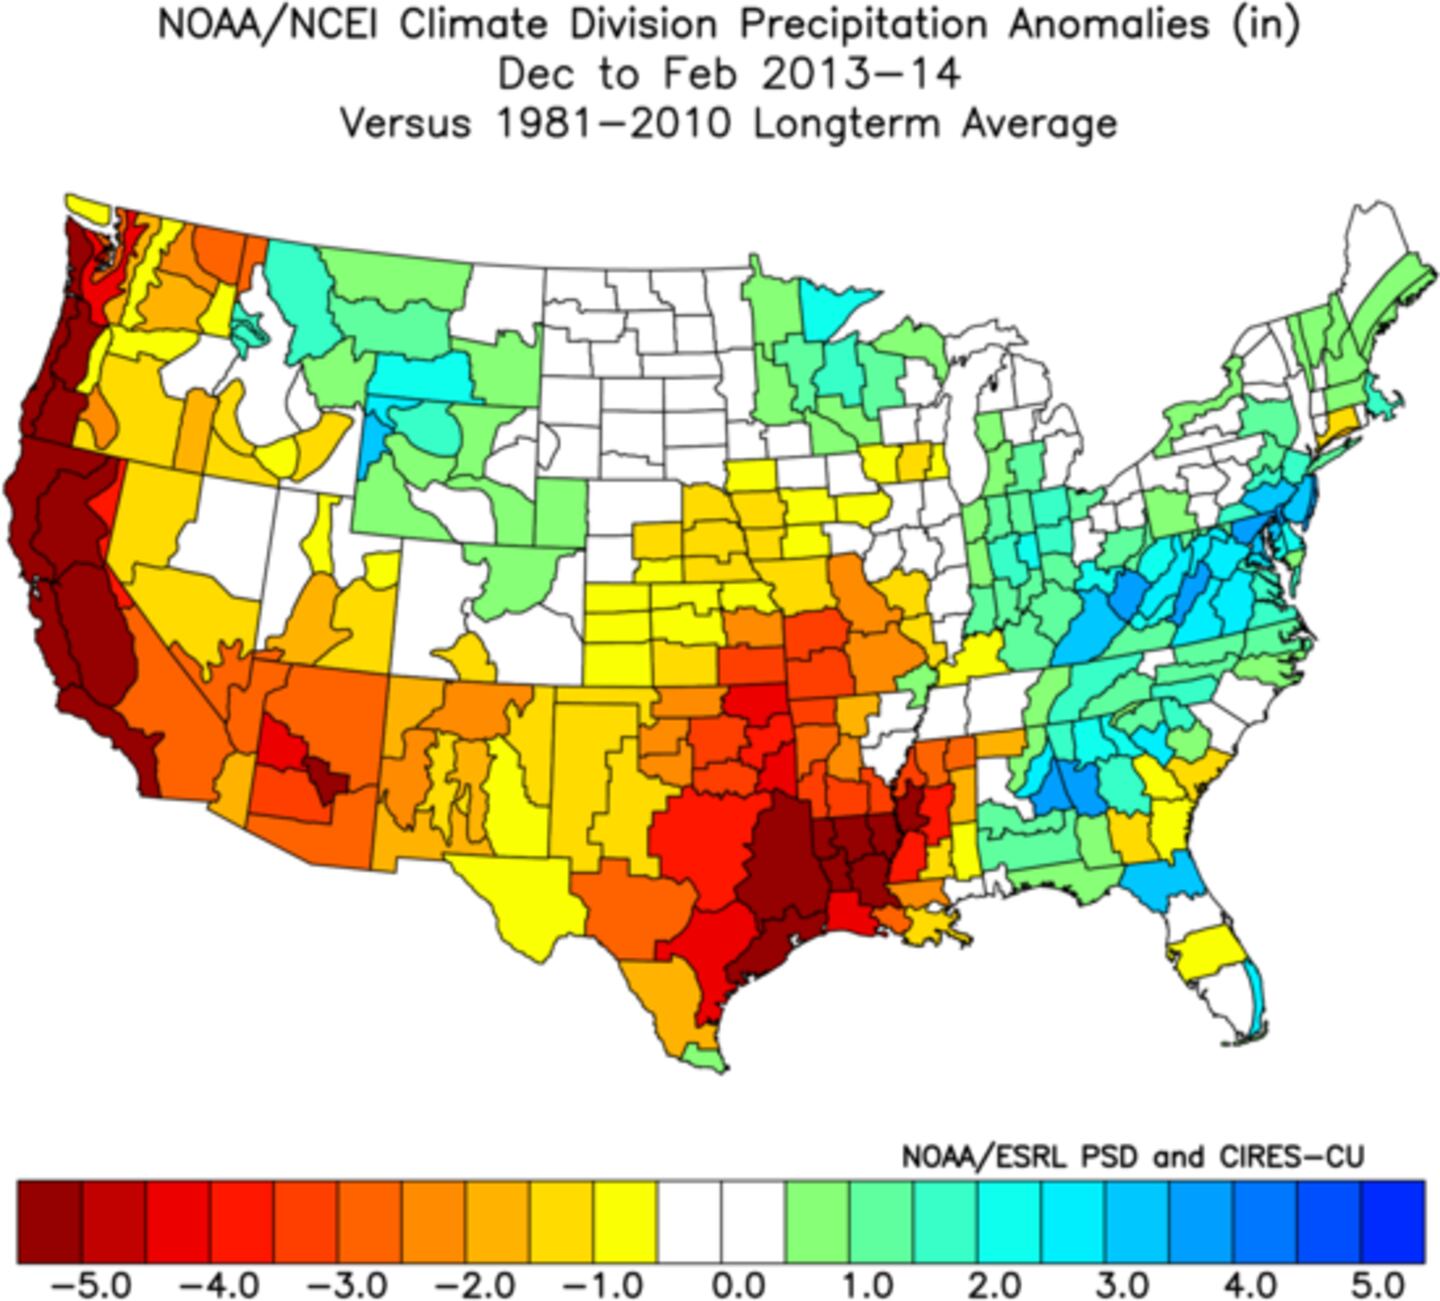
October temperatures last year compared to this year, not too different in the Southeast:

The winter that followed mild and wet, last winter:

This season I anticipate multiple storm tracks with three primary, most to our North, but with a somewhat active sub-tropical jet stream across the Southern tier of states at times while the main polar jet storm tracks will be across the Midwest/Great Lakes.
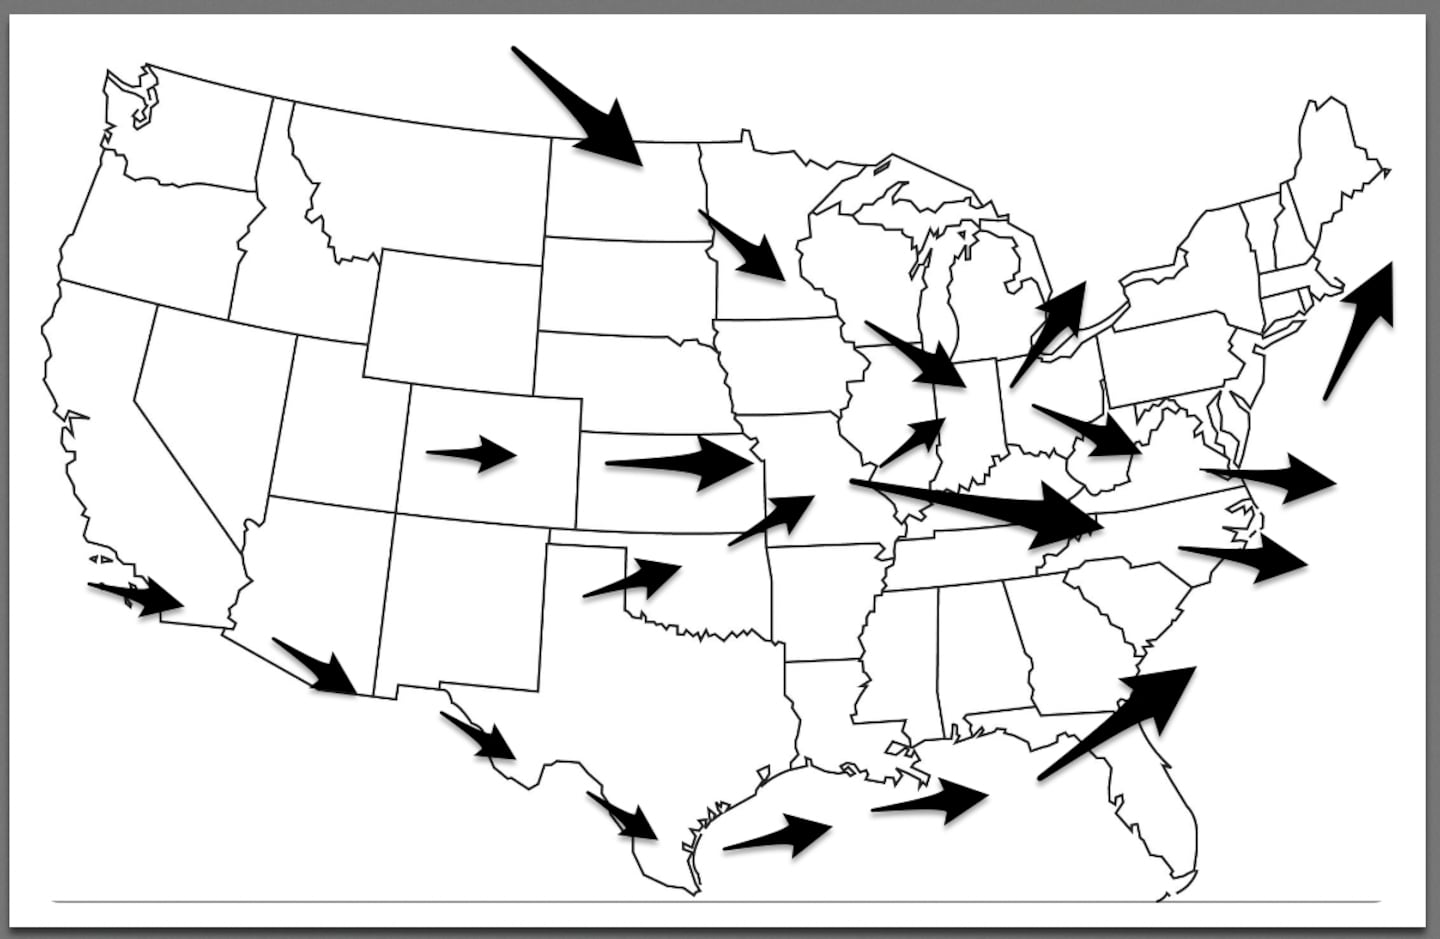
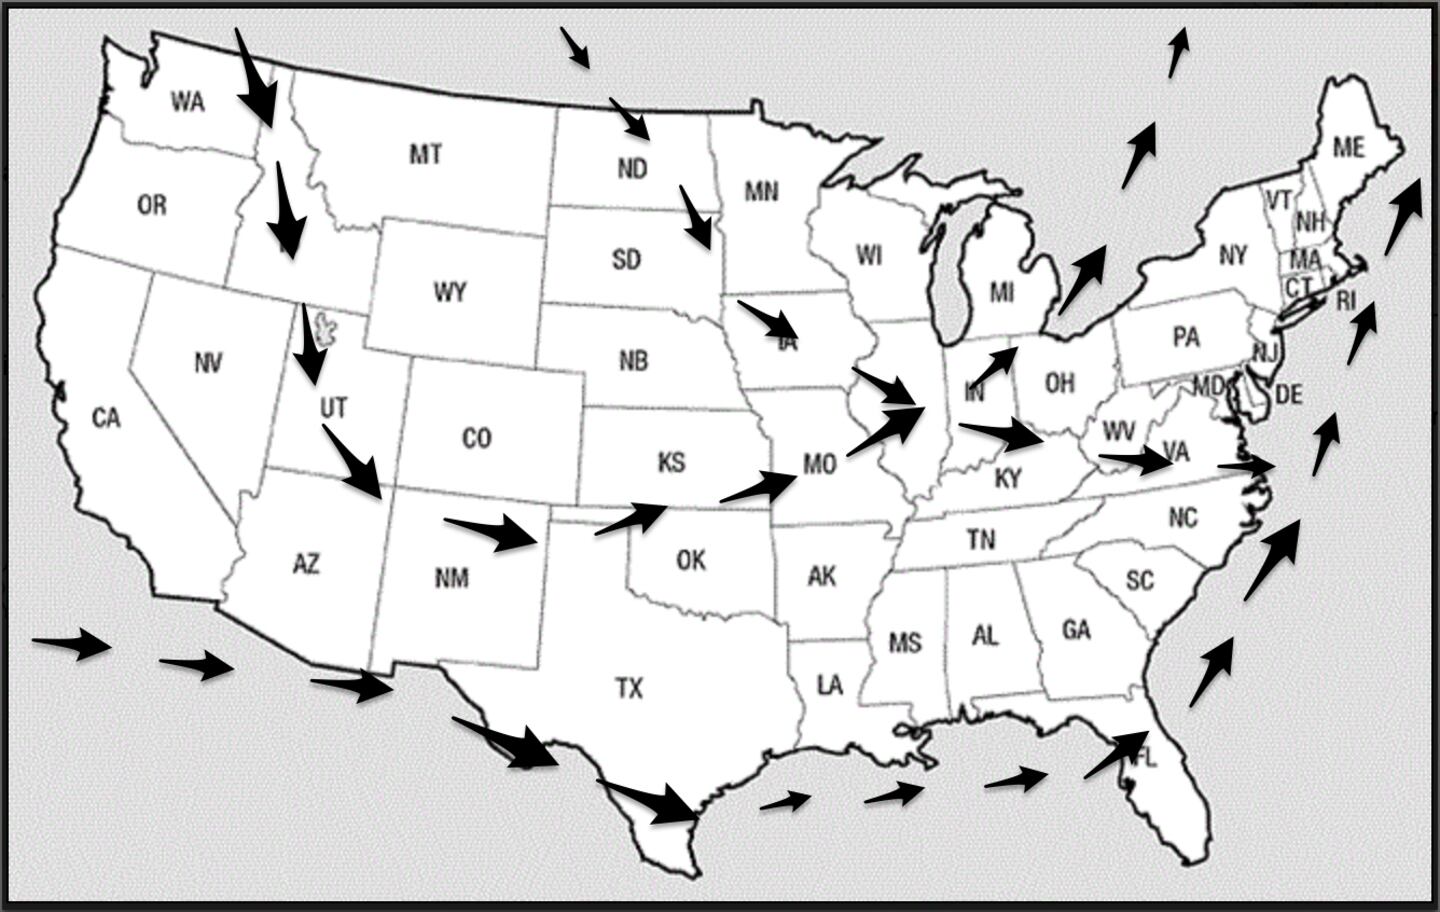
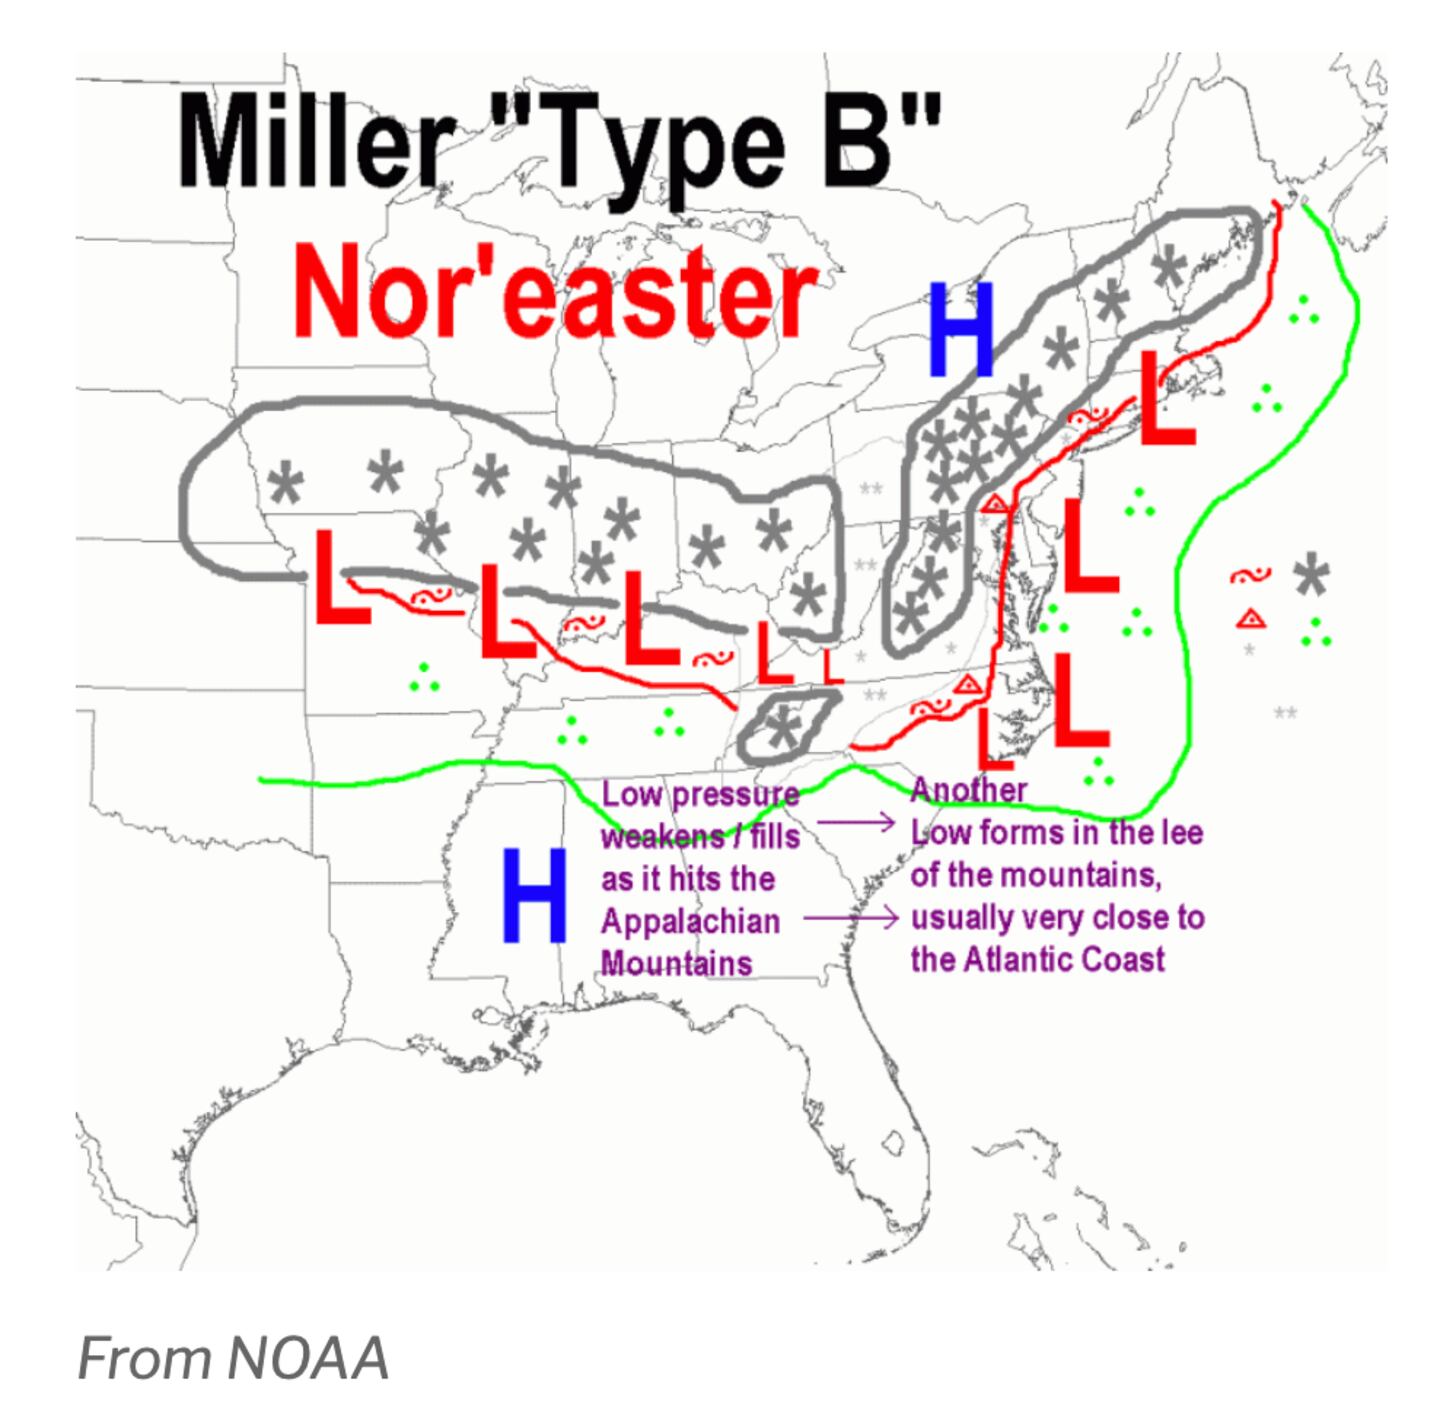
To me it looks like main storm track types will be Colorado cyclones (4 corners), Pan Handle hookers, Alberta Clippers, and Miller type B cyclones. The opportunity for Miller A type cyclone tracks does look to be present especially at the back end of winter, mid-January to mid March.

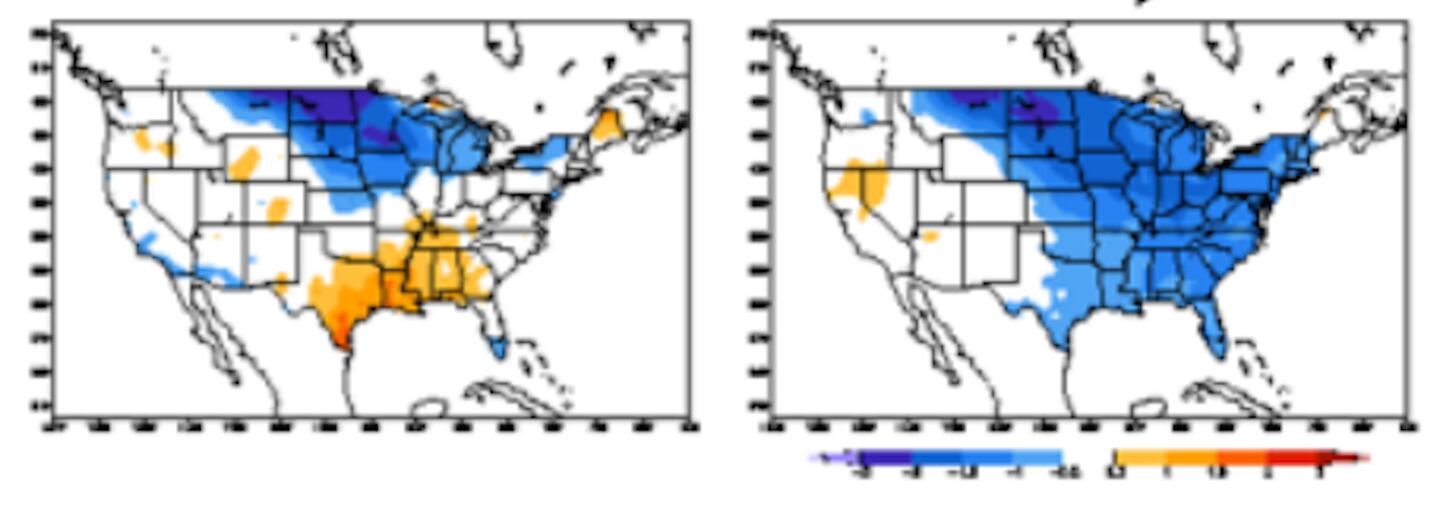
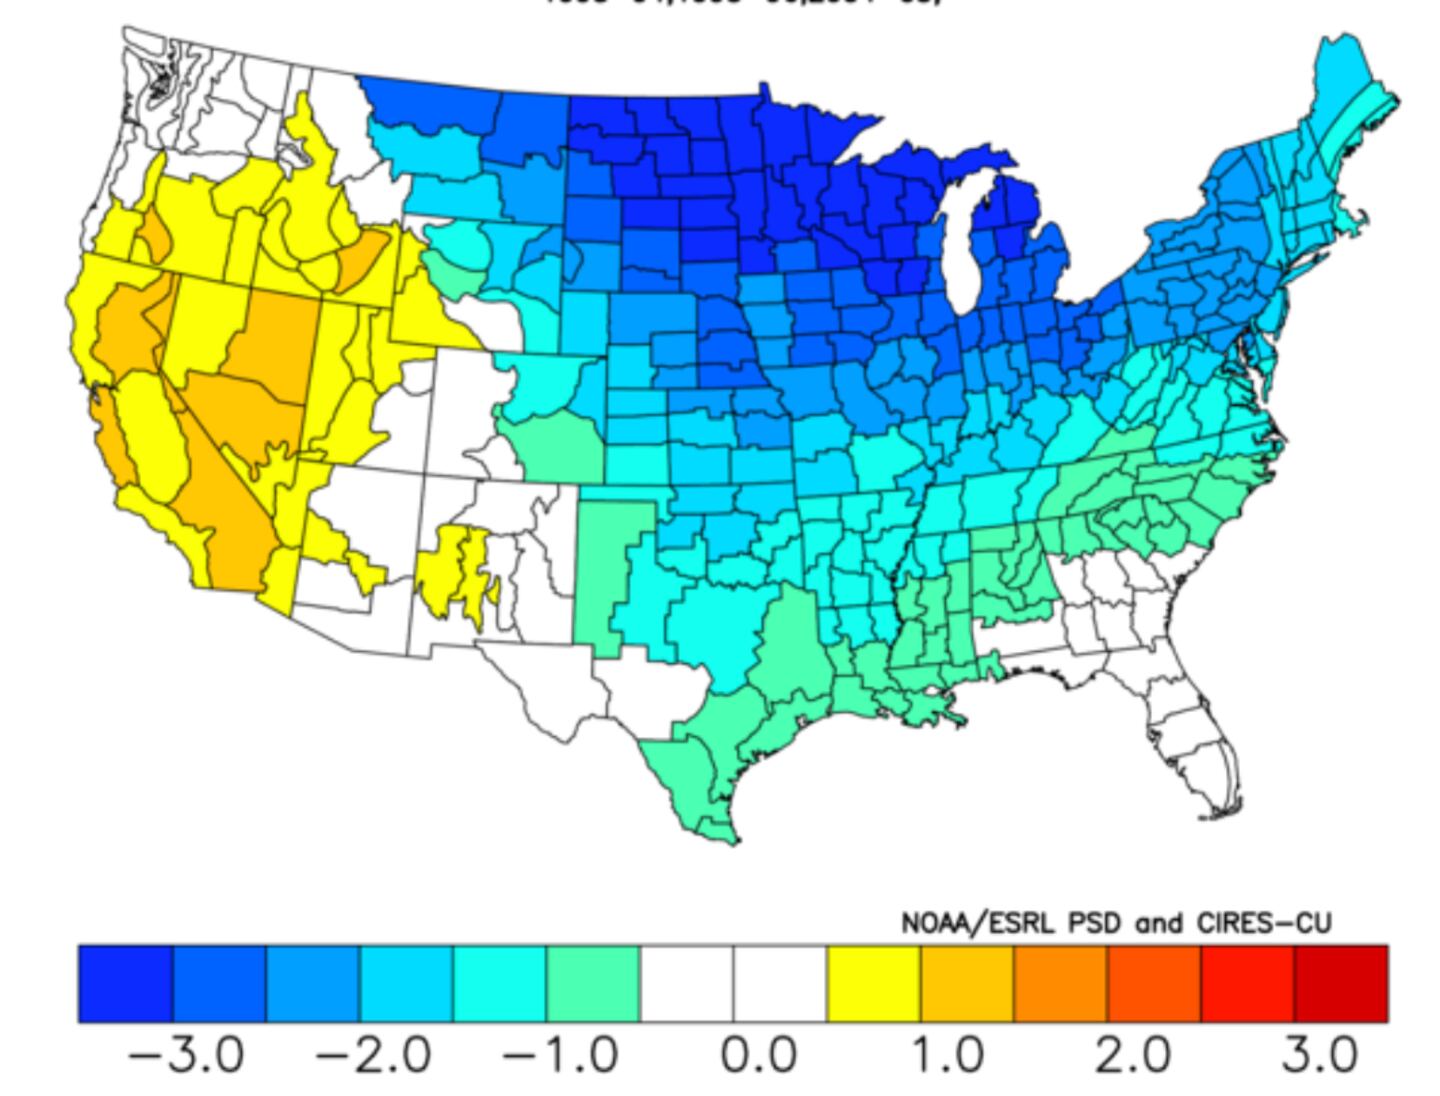
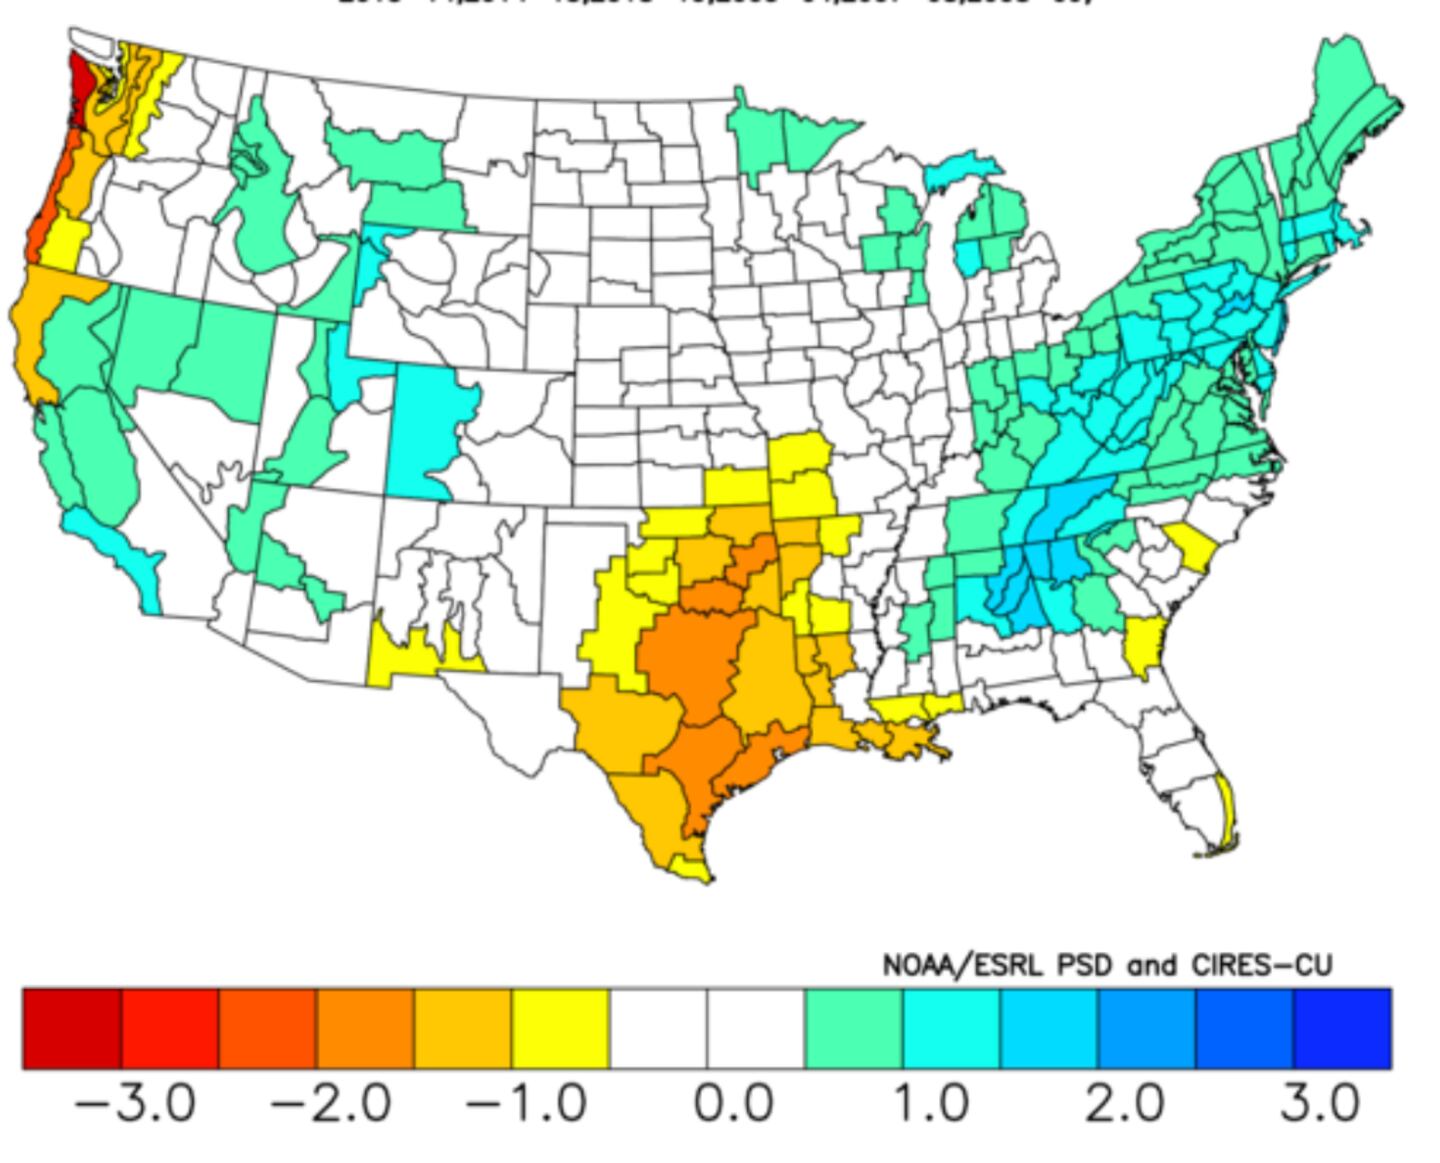
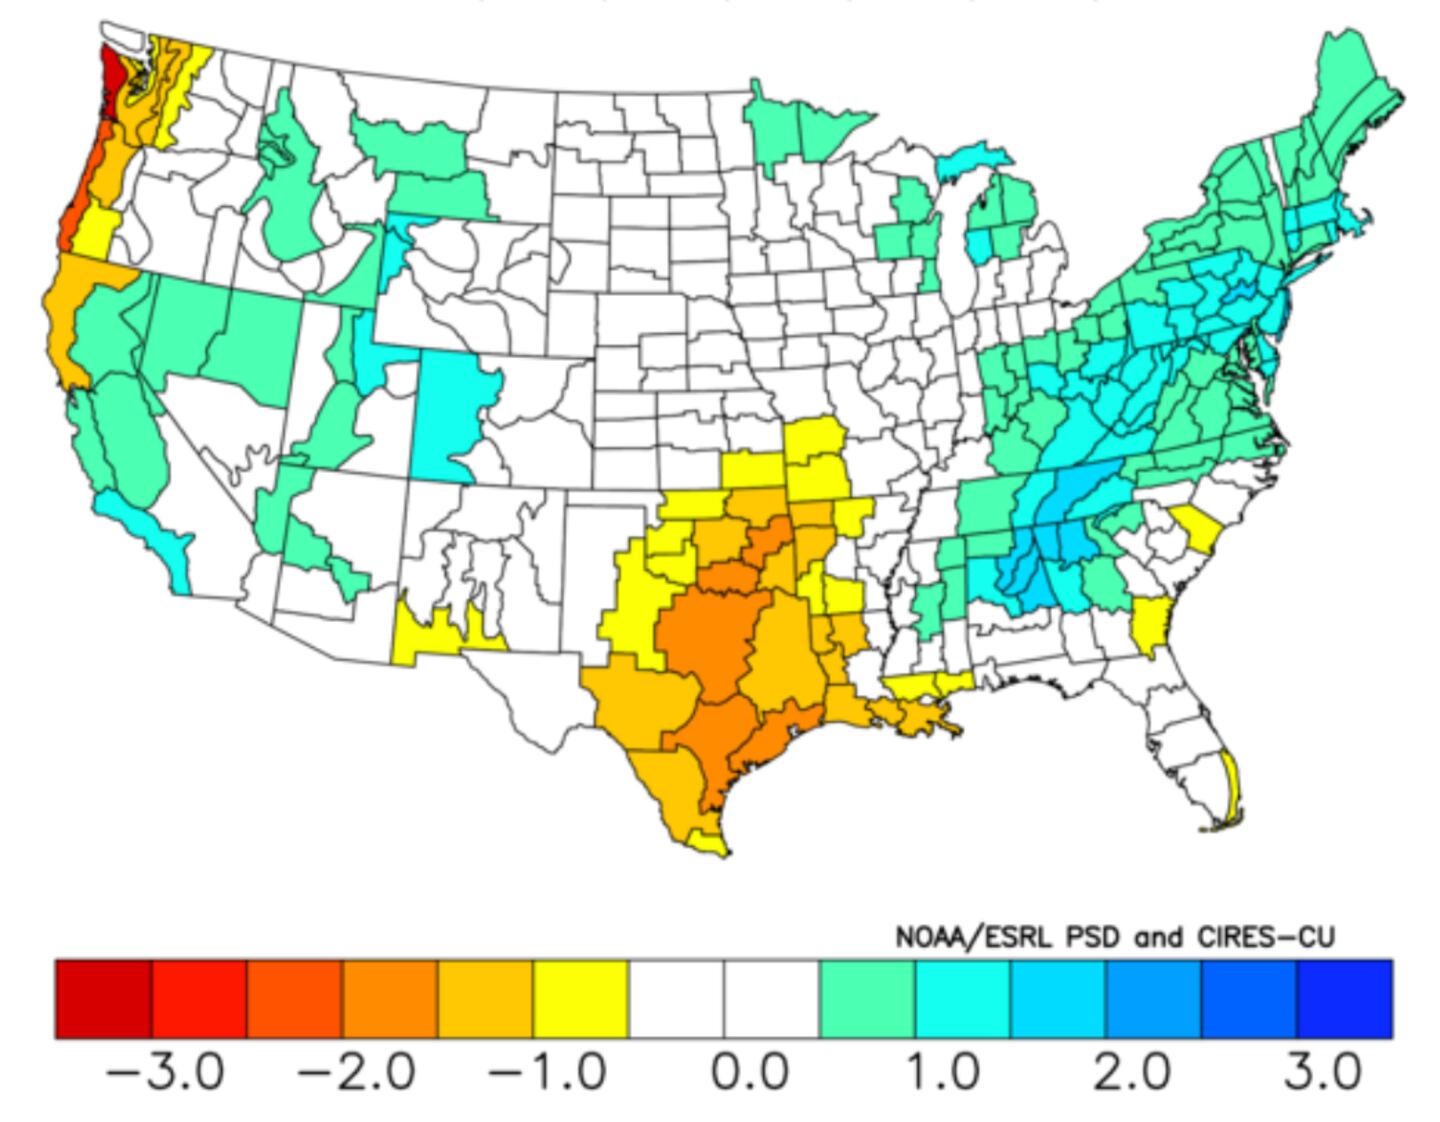
WINTER 2019-2020 TEMPERATURE AND PRECIPITATION 3-MONTH AVERAGE DECEMBER-FEBRUARY.
TEMPERATURE DEPARTURE FROM NORMAL D-F, FOLLOWED BY MAP OF PRECIPITATION DEPARTURE FROM NORMAL D-F:
ANALOG YEARS AND BOTTOM LINE:
1936, 1951, 1955, 1959, 1961, 1969, 1977, 1978, 1979, 1980, 1983, 1993, 1995, 1999, 2002, 2003, 2004, 2005, 2007, 2008, 2012, 2013, 2014, 2017, 2018.
I used the best match analogs to create the composite temperature and precipitation maps above.
Of the top 14 analog years 11 had measurable snow, with the average being 1.7 inches. The range was 0 in three years, less than half an inch in three years and a high of 4.6 in one year.
So my outlook projects the winter as a whole to have temperatures average near-normal to a bit below-normal with precipitation normal to above-normal (adjusting the analog drier) with snow/ice odds about normal. Remember this is the average for the 3-month period DJF not every day or every week.
There is plenty of reason to expect periods of dry weather and warm spells with above-normal temperatures.
But it’s certainly possible that when October and November inputs become available the analog list may need to be adjusted colder or warmer. I’ll do that update about December 1st if it looks necessary.


 Sign Up

