This is not going to be a complicated “deep dive” tutorial. Just a fun little tidbit for anyone who’s really into weather to store away and practice at home. The maps/data are readily available for free on the internet, use your favorite search engine.
Nowadays many “meteorologists” were taught the models and to click on model precipitation charts and model generated simulated radar and make that their forecast. They are very useful tools to look at but should NEVER be the SOLE basis of a forecast, that requires training in synoptic meteorology or operational meteorology- weather analysis and forecasting.
Back in the day severe weather outlooks were very generalized and usually only issued for that day or maybe 1-2 days. So if you wanted to know if there was at least a chance of severe weather many days in advance you had to know what parameters to look for in the data that was available, none of those pretty colorful “futurecast” moving maps existed. Same thing for snow/ice location and amounts, you were trained to figure it out yourself without point and click “answers” from models. But that’s a topic for another day. Glad I learned all those techniques.
I’ll now give a very simplistic rule of thumb, used to forecast a severe weather outlook area using JUST 3 PARAMETERS. Mainly just 2.
It works somewhat in Fall and Winter, but is best in the spring months until June.
HERE IT IS...
(1) Barometer reading (atmospheric pressure)
(2) Surface dew point (measure of moisture in the air)
(3) Ahead of cold front
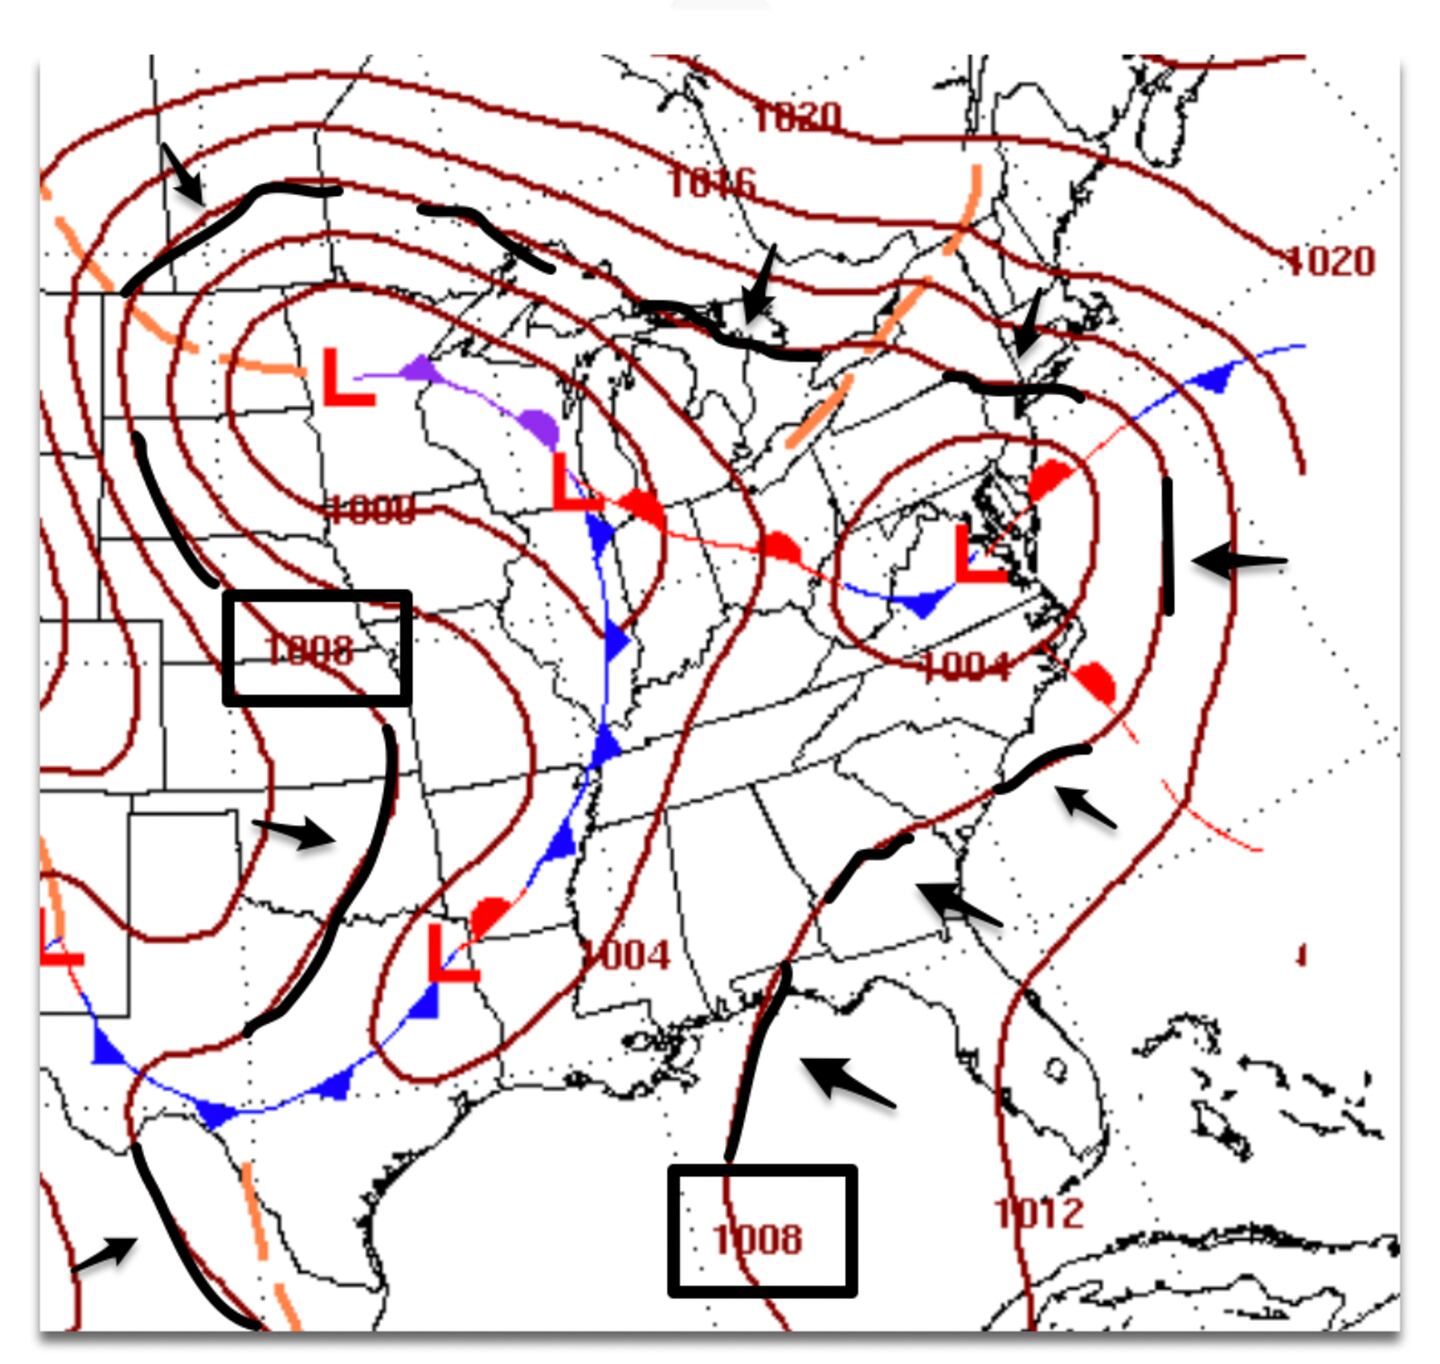
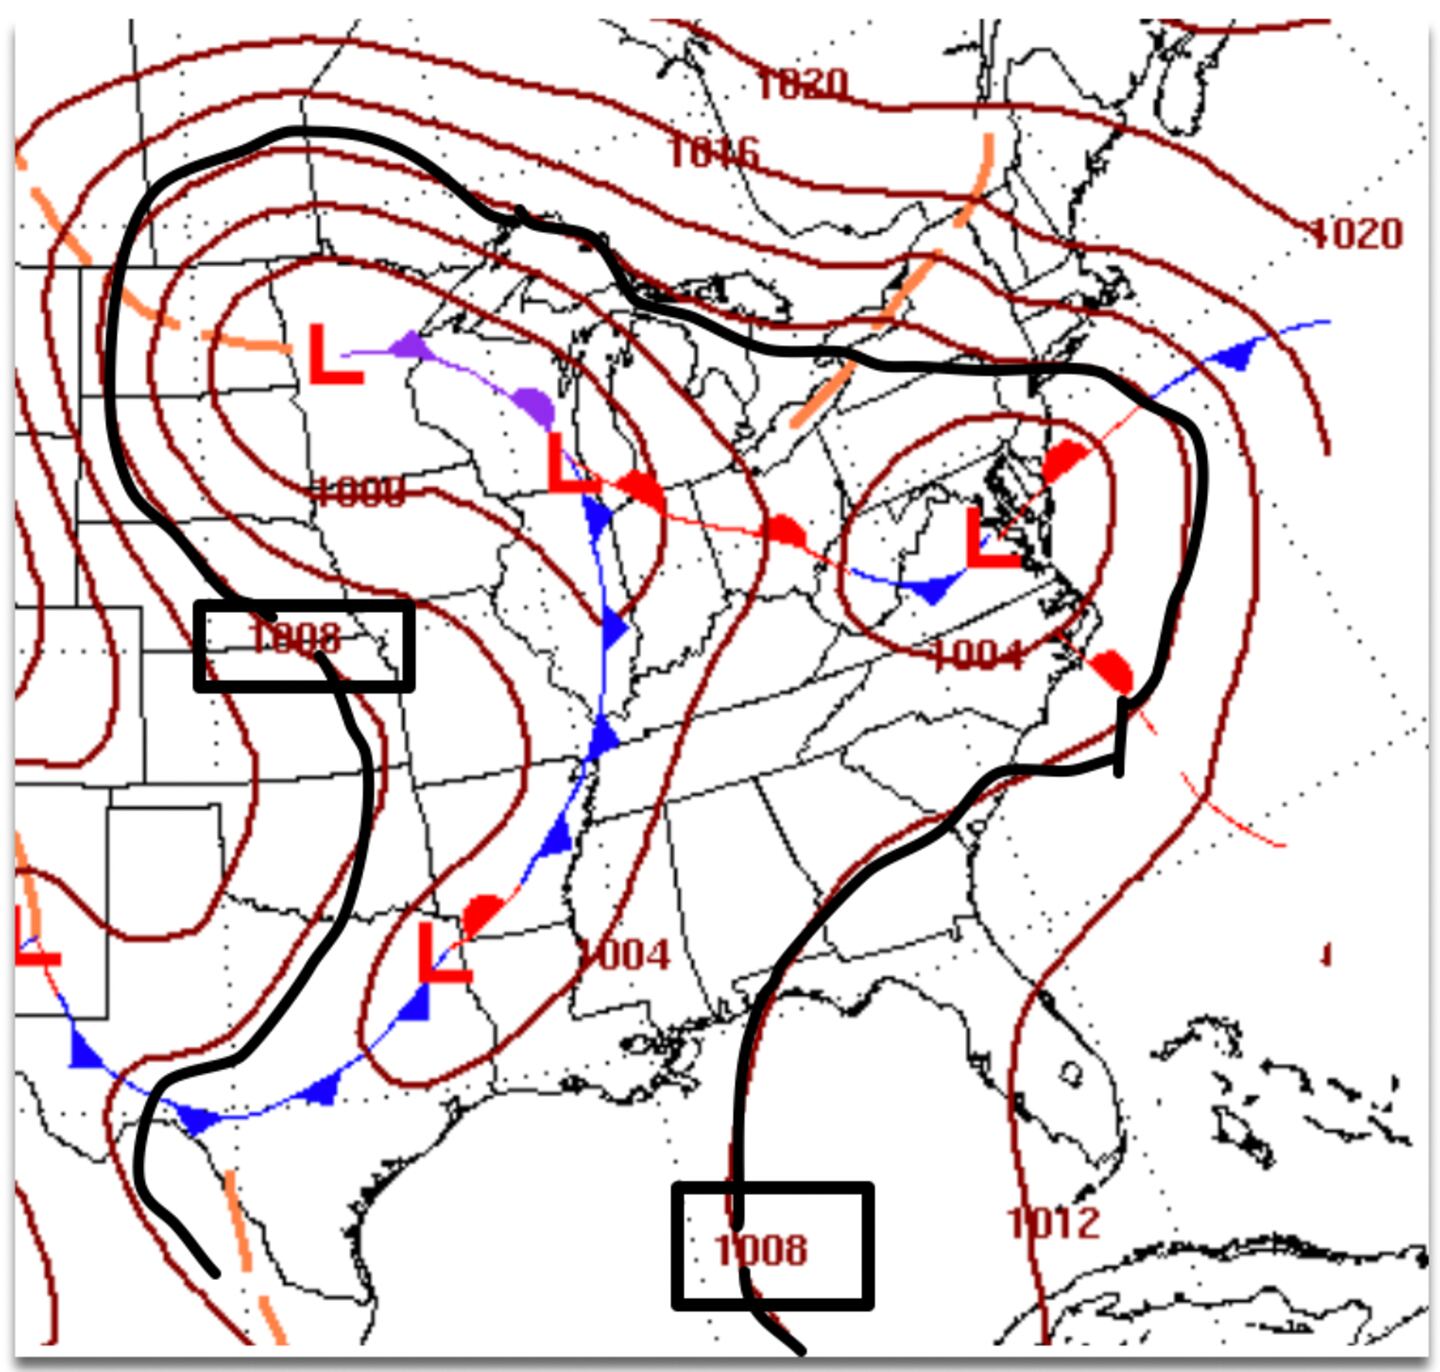
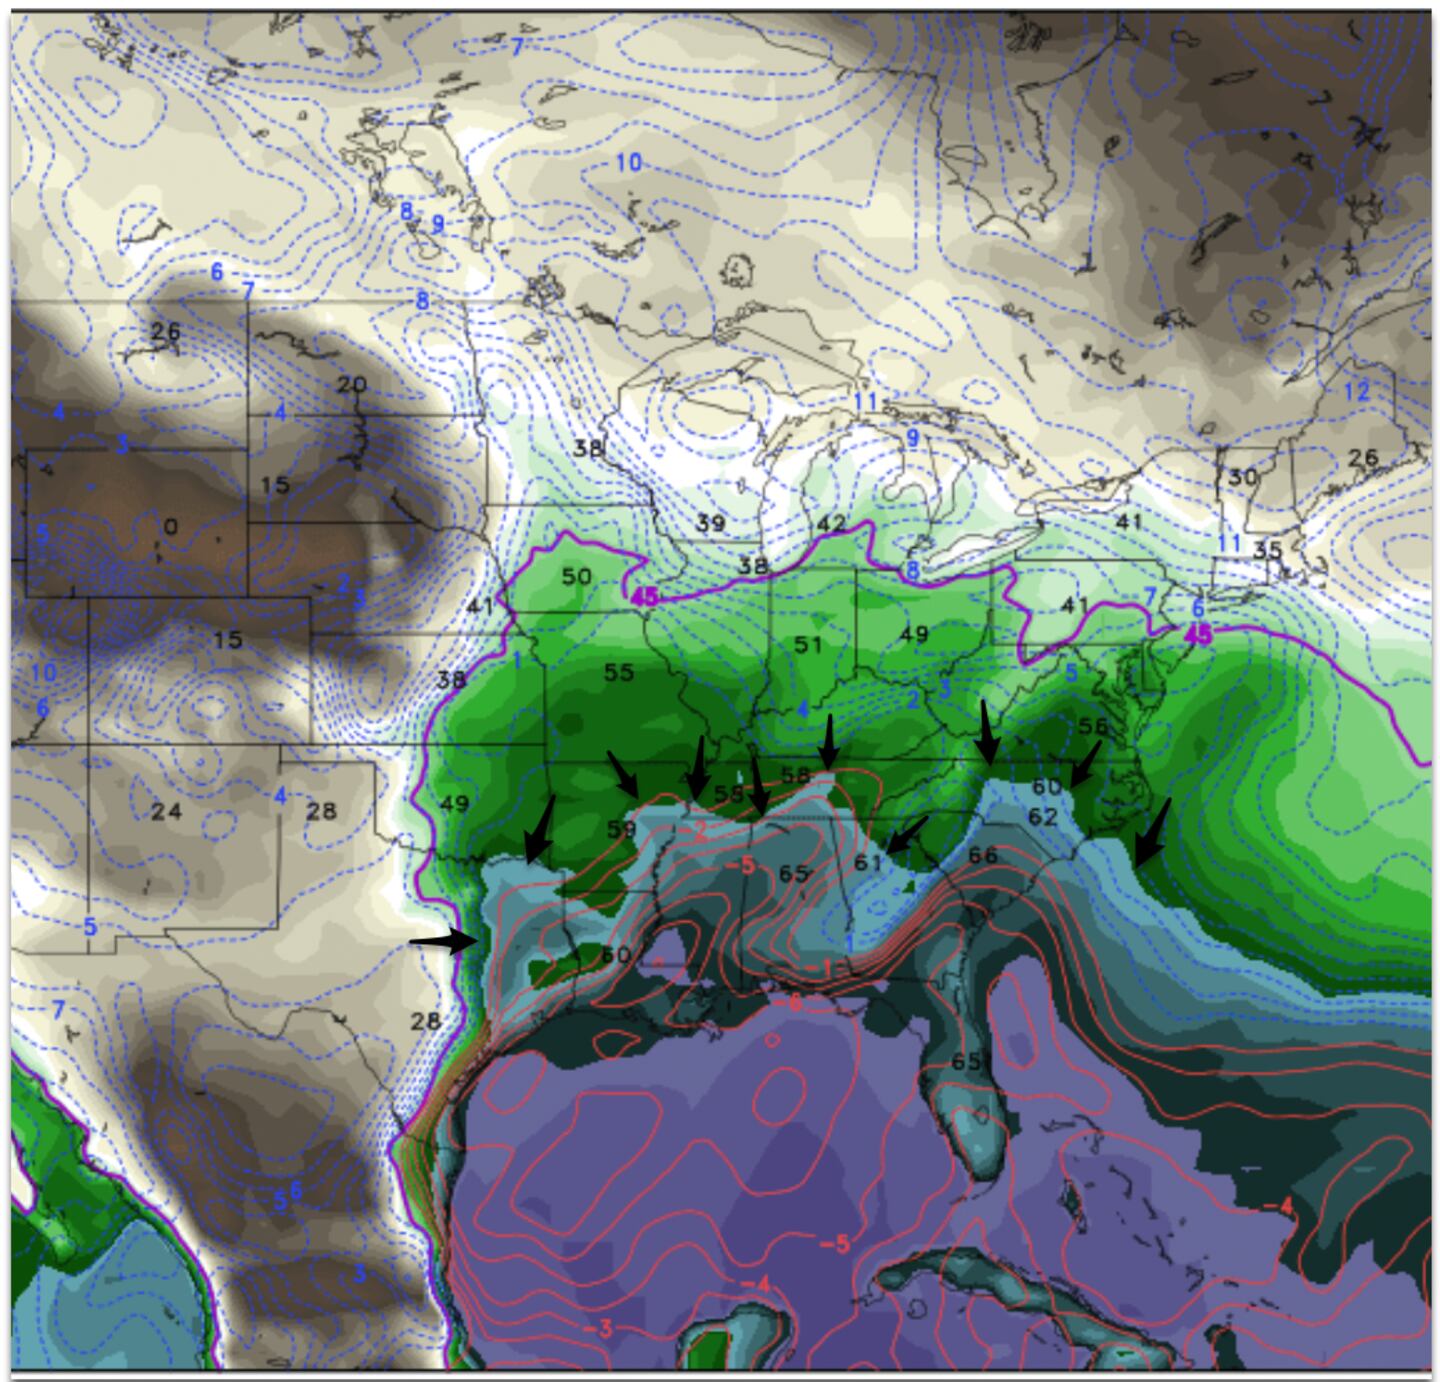
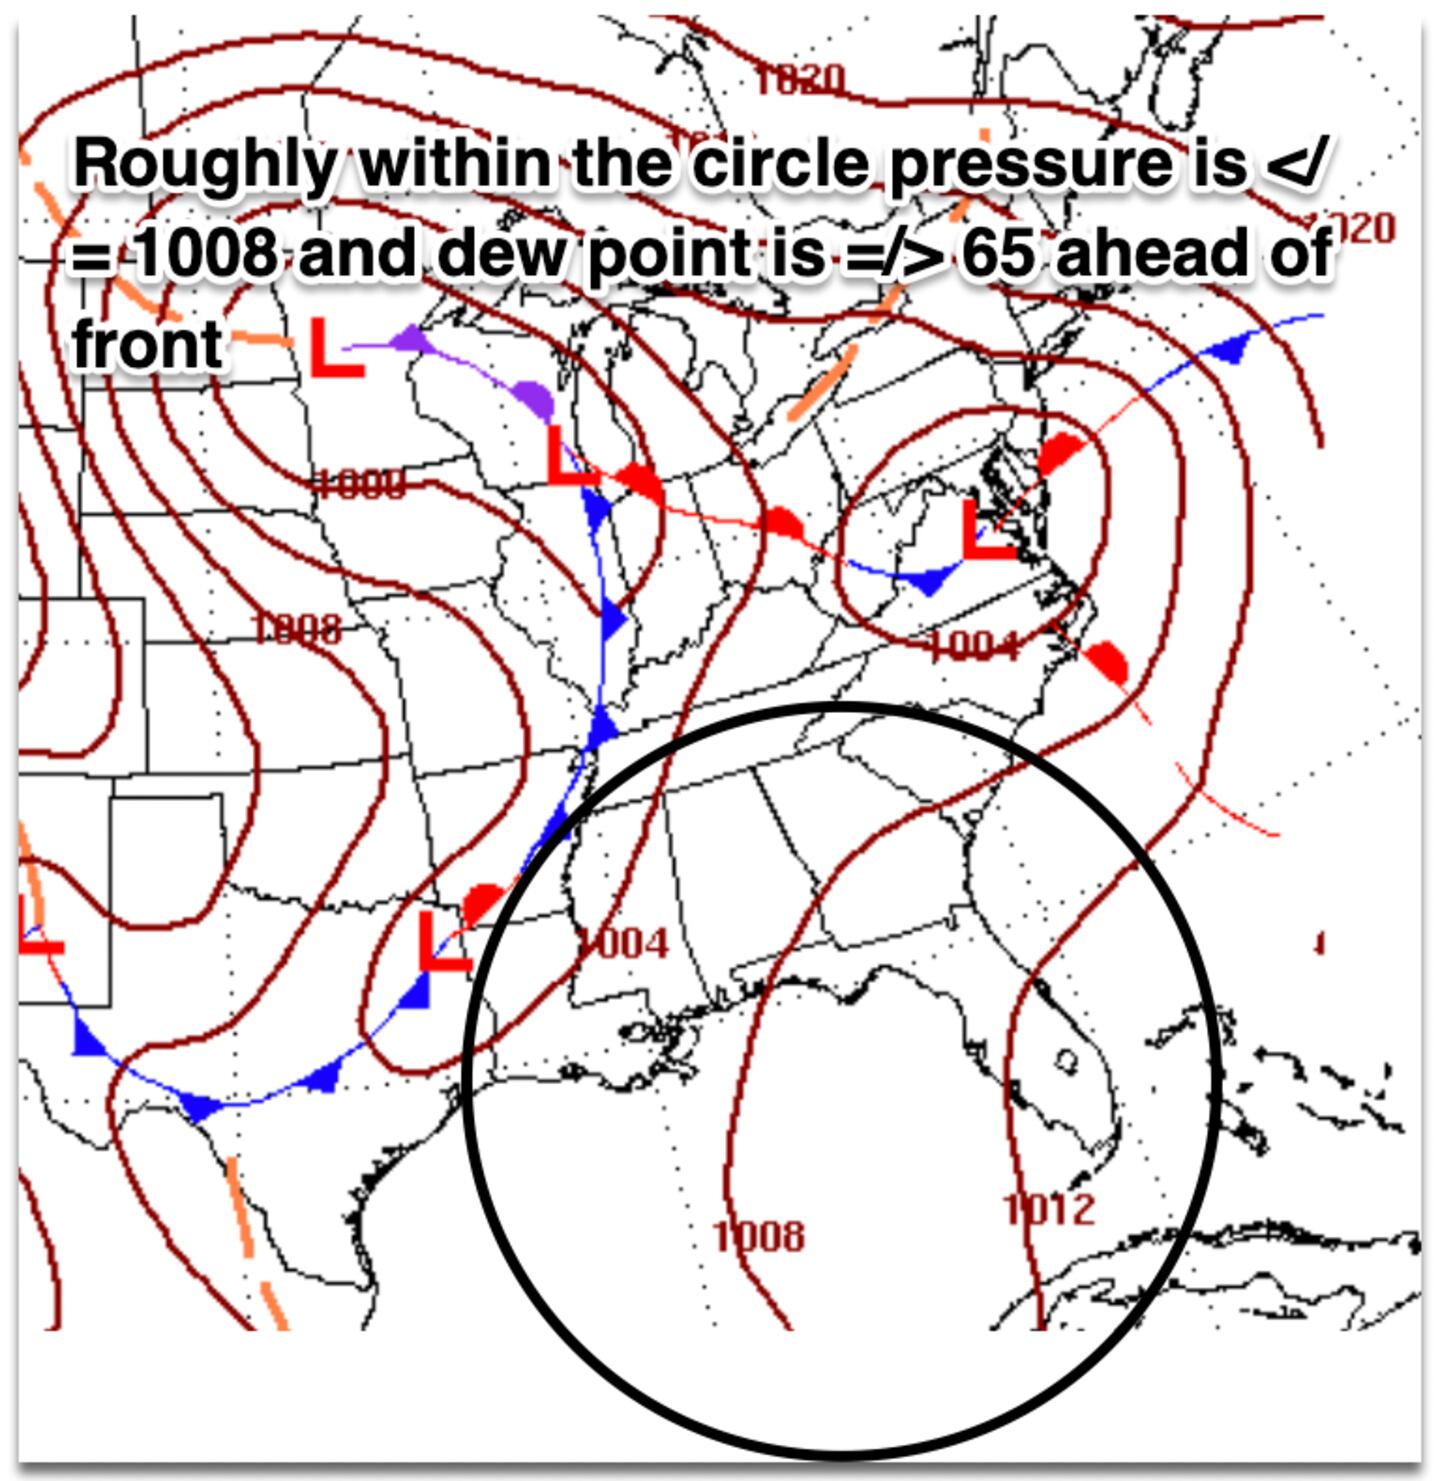
Look for where the surface pressure (barometer) is 1008mb (29.77 inches of mercury) or lower AND the dew point is 65 or higher ahead of a cold front.
THAT’S IT.
(mb stands for millibars)
Where these conditions intersect and overlap is where there is a decent chance for severe thunderstorms. It’s just that simple.
Remember, the real atmosphere and real forecasting is NEVER that simple or easy. But this is not a severe weather forecast college course.
EXAMPLE:
Looking at a generalized situation this Tuesday/Wednesday 4/12-13:
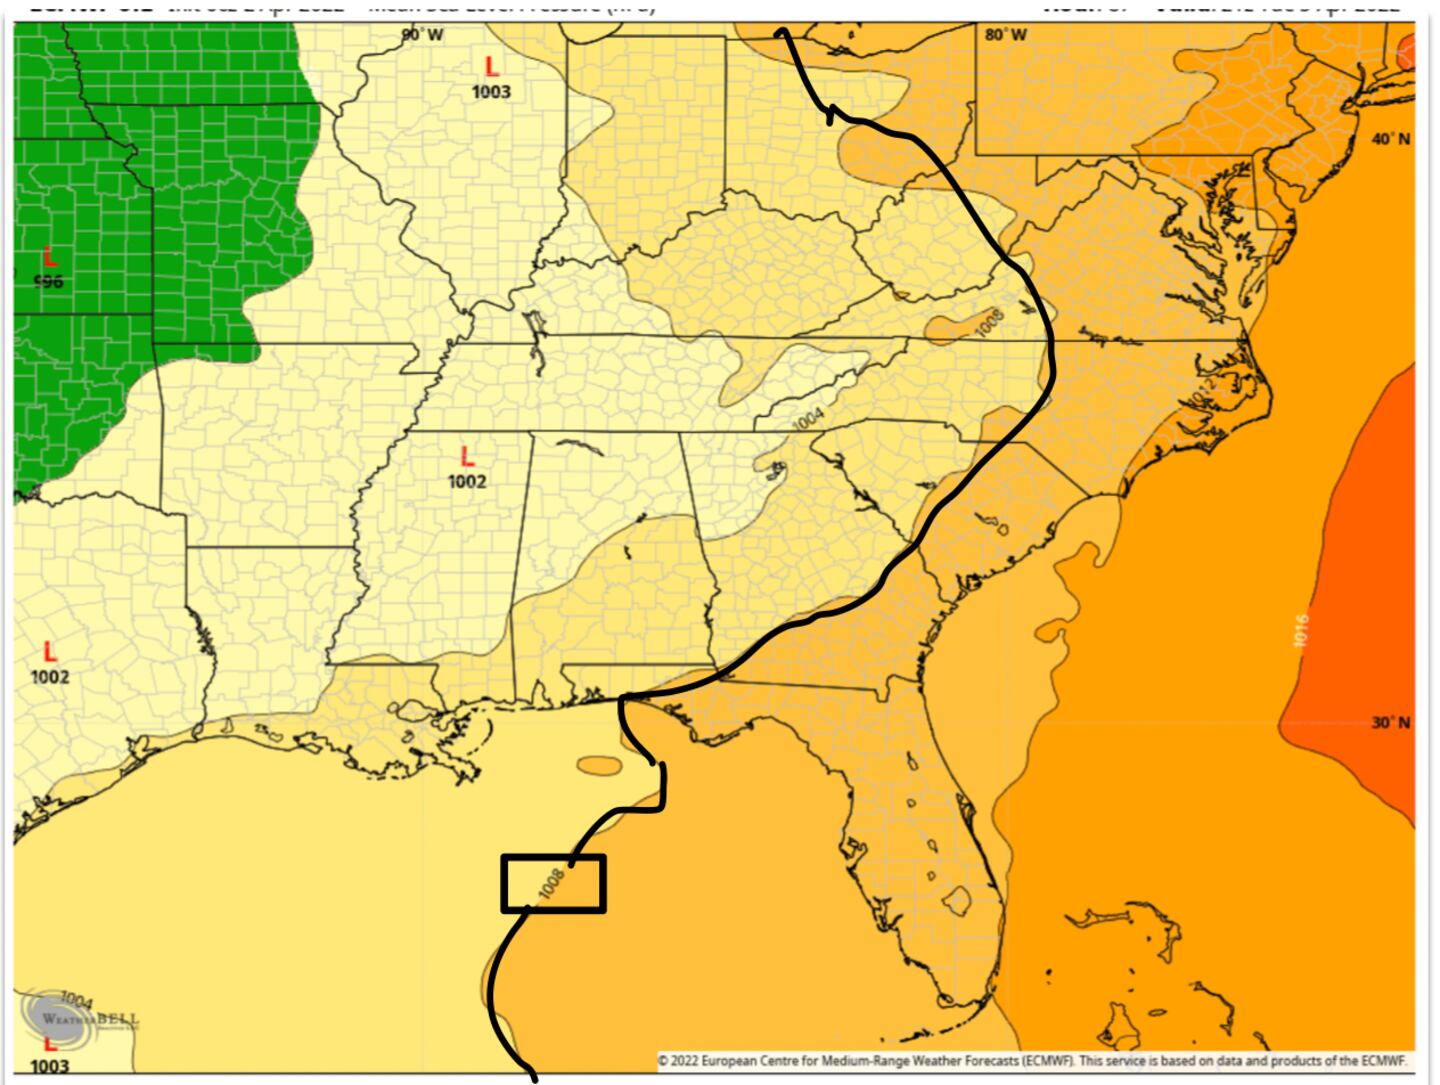
**Some forecasters prefer to use a dew point of 60º instead of 65º. I’ll show both.
As a side note, a dew point of 55º is generally considered the MINIMUM requirement for severe weather.
FORECAST DEW POINT MAPS:
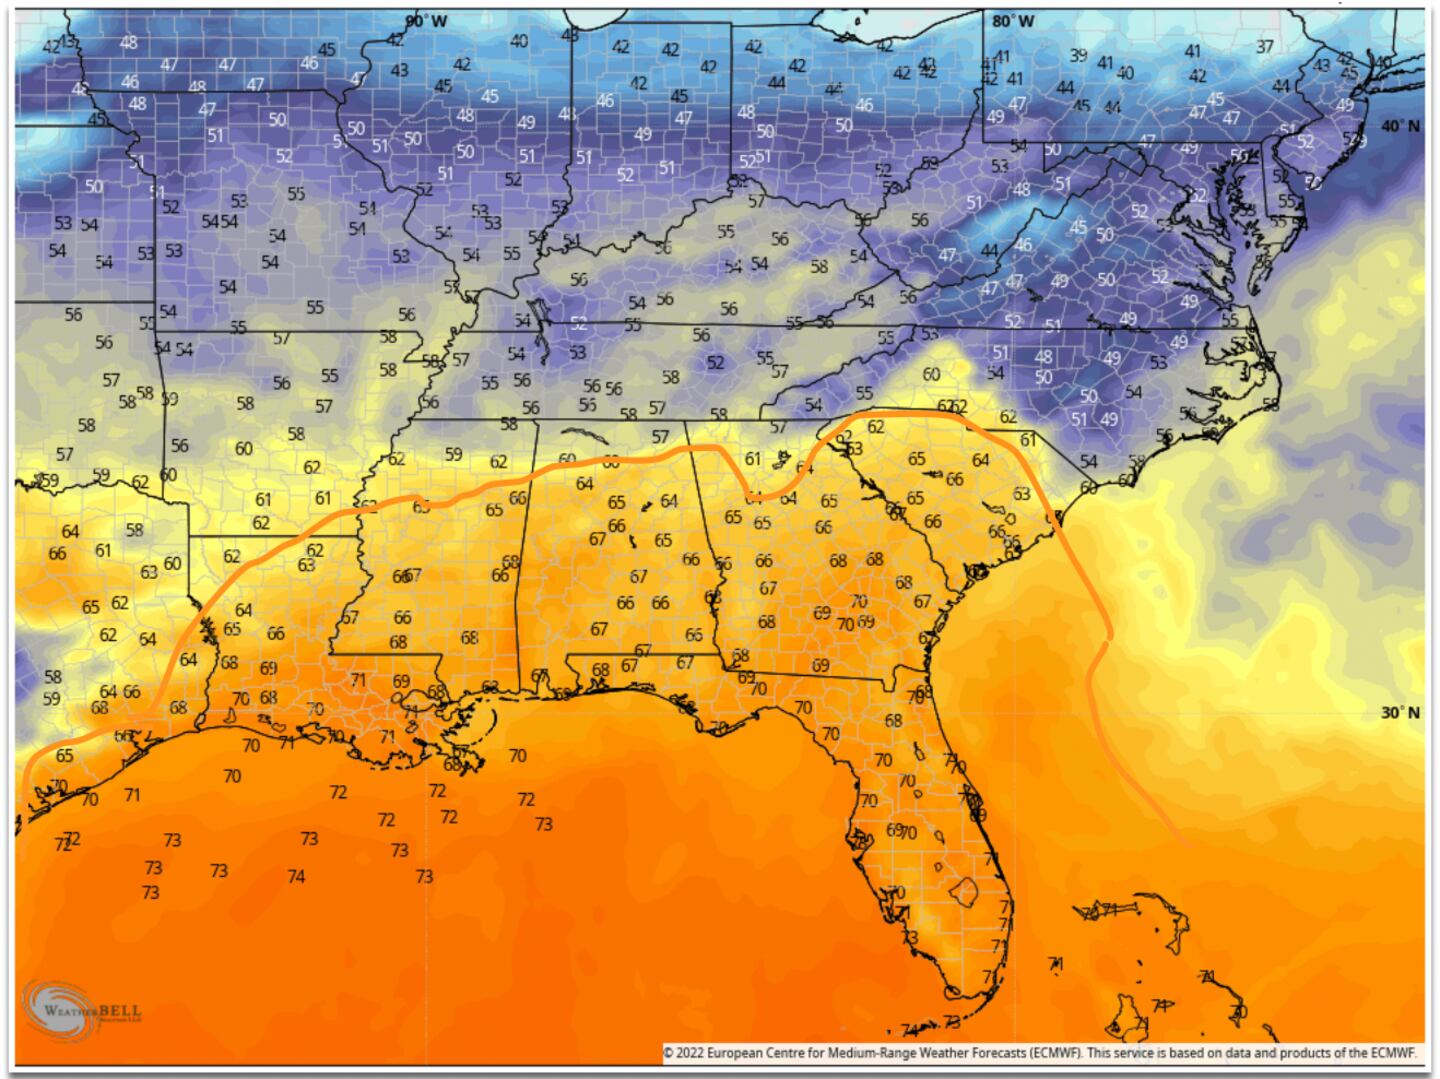
Remember these are model forecast charts that came out Saturday morning, they will change in the days ahead so check the LATEST to update your forecast.
IF these forecast charts verify as correct, they show Atlanta meets the criteria as far as pressure goes, but just barely meets the dew point criteria give or take, since metro Atlanta is a huge area, not just in or near I-285.
Now let’s CHEAT, and see how this overly simplified rule of thumb compares to the Saturday morning 4/2 official outlooks from the NOAA/NWS/Storm Prediction Center:
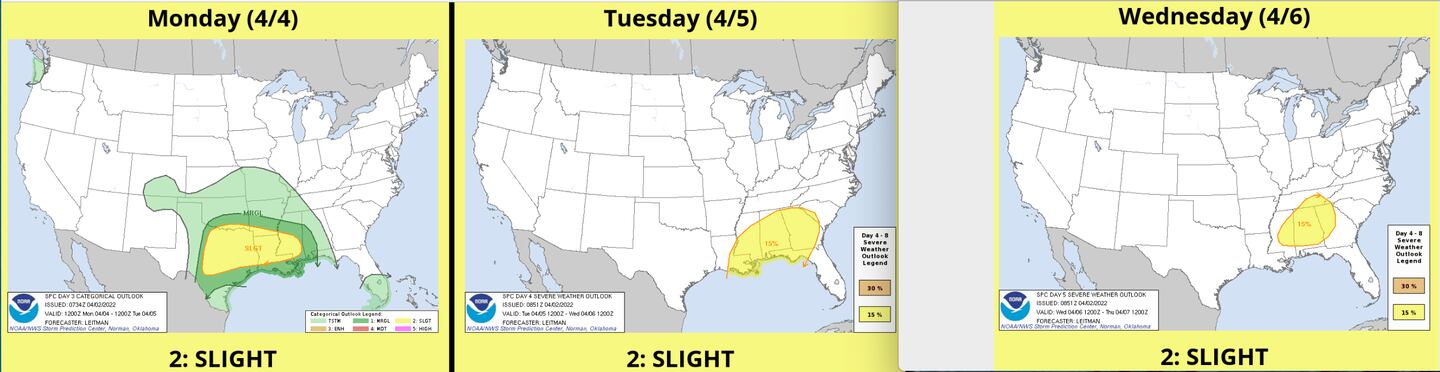
Not too shabby eh? We did well.
Give it a try in the weeks and months ahead and see how you do. Fun.
An added benefit to this method beyond simplicity, is it will sometimes give you a heads up even BEFORE the experts at SPC issue their own official outlook, so you can get an early heads-up.
Keep in mind the forecasters at the Storm Prediction Center based in Norman, Oklahoma base their official forecasts by looking at hundreds even thousands of data points not just these three, but the match shows our simplified method has merit.
For other weather tidbits follow me on Twitter @MellishMeterWSB.
©2022 Cox Media Group