This has implications for the coming winter.
El Nino and La Nina or the El Nino Southern Oscillation (ENSO) in the equatorial Pacific Ocean is a major driver of weather and climate across the globe, not only in winter but all year. La Nina is Spanish for “The Girl”, El Nino is Spanish for “The boy”.
They can be weak moderate or strong and can be Central Pacific-based (MODOKI) in core location, East-based, or basin-wide also known as conical. Generally speaking as you would expect, the stronger the event the more influence it has on weather patterns.
There are other ocean areas across the hemisphere where warm or cold pools of sea-surface water influence the weather, these together are called teleconnections, because they “connect” with prevailing jet stream patterns and thus can be used-- without computer models-- to “telegraph” future weather patterns.
What happens 1000′s of miles away influences what happens in our own backyard, the technical term is teleconnection.
When there is an ENSO signal we can look back in history to see what kind of winter, summer, or hurricane season accompanied them based on matching the current ENSO with similar ones from the past. These are analogs which give us a “composite” or average of the ENSO type on typical seasonal weather.
This will be a second winter in a row with a Pacific La Nina or a “double-dip” winter. A “double-dip” La Niña is not uncommon—seven La Niña winters in the 1950-present historical record followed La Niña the previous winter: 1955, 1971, 1974, 1984, 1999, 2008, and 2011. In fact, two years, 1975 and 2000, were third-year La Niñas. Only four years, 1964, 1988, 1995, and 2005, were single-year La Niñas.
The “anomaly” or difference from average of the sea-surface temperature (SST) (SSTA) or departure from normal is a key measure.


COMPARISON OF A STRONG LA NINA VS. A STRONG EL NINO:

CURRENT OBSERVATIONS:

Most recent La Ninas are 2016, 2017 and 2020.
While we don’t need computers to measure and see ENSO conditions, we do use both statistical and dynamical models to try to predict how strong an ENSO event will get and how long it will last.

AVERAGE GENERALIZED LA NINA IMPACTS DECEMBER-FEBRUARY:

PAST LA NINA AVERAGE TEMPS AND PRECIP FOR THE NOVEMBER-MARCH PERIOD:


WEAK TO MODERATE LA NINA WINTERS (USING ONI MEASUREMENT):


Of these 19 weak to moderate La Nina winters 14 were warm in Georgia 5 were cold. 74% above-normal temps.
Of the 19, 8 were wet while 11 were dry in Metro Atlanta. 58% with below-normal precipitation in Metro Atlanta.
LA NINA SNOWFALL ANOMALIES:

REMEMBER: this is an average composite of La Nina, but they can and do differ from the average. That’s typical of Mother Nature. 7 out of 11 (64%) of past 2nd year La Ninas averaged warmer than normal in most of Georgia. 2000-2001 was the most recent cold one, 2017-2018 was the most recent double-dip warm one.
DOUBLE-DIP 2ND YEAR LA NINA WINTER TEMP AND PRECIP COMPOSITE:


The expectation over the summer has been that this would be a WEAK La Nina. However, some new model output is pointing to a MODERATE event or even a strong one, but that is not yet the consensus. The three major ENSO forecasting services: United States, Europe and Australia all forecast a La Nina, the U.S. CFSv2 is forecasting the strongest while the Australian is the weakest:
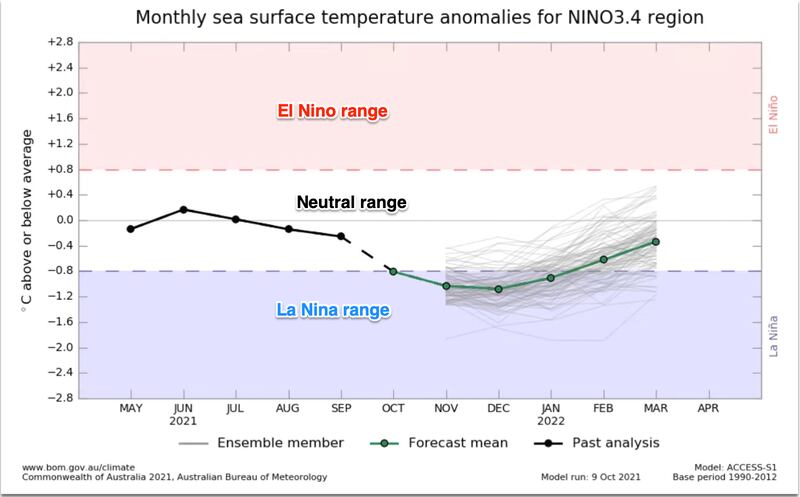

While they disagree some on the strength of the La Nina ALL of the models show the La Nina weakening January-March.
This will need to be monitored in the months ahead because as mentioned earlier the likely impacts skew between weak and strong ENSO events.
Some La Ninas are East based and some are central pacific based:

HISTORIC RECORD ANALOG FOR LA NINA TYPE:

10 CLIMATE MODELS PROJECT A CENTRAL BASED LA NINA FOR WINTER:


At least as of now anyway, looking at all data ENSO and models and other factors, the strongest signal is for a drier than normal winter in most of Georgia. The signal for temperatures is not as strong with more spread of possible outcomes.
Either way La Nina is not everything, it’s not the be-all and end-all of seasonal forecasting. Other factors play a role and sometimes take control unexpectedly.


Stay tuned for more in the months ahead.
You can follow me on Twitter @MellishMeterWSB.
©2021 Cox Media Group