I love snow. It's why I always love to watch it fall, examine the flakes, and go for a walk in a snowstorm. Beyond its beauty and relative rarity versus rain, I always view it as a miracle. One we can experience first-hand.
I don't think people realize just how difficult it is to get snow. No we can't just spray a water bottle into our freezer and make it snow.
Ski resort snow makers and shaved-ice type snow parks are a different animal and are beyond the purpose of this blog post. That stuff is not real snow.
The microphysics of real snow from the clouds are amazing. Don't worry this won't be that level of explanation.
Precipitation requires condensation nuclei and the nuclei that grow ice crystals are not activated until the temperature falls to about -10 degrees Celsius. Ice crystals and snow flakes do NOT automatically form once the temp falls below freezing.
Because of that complexity you can get rain with an outside temperature of 18F, or have snow at a temperature of 39F.
Remember precip doesn't fall from the ground up it's from the sky down. :)
So the gist is snow requires VERY SPECIFIC CONDITIONS to develop! But not just the right temperature, there must also be sufficient "lift" or upward motion in the air (omega) and moisture saturation. IF ANY of those specific requirements are not met at any point in the atmosphere from the ground to ABOVE the clouds, you end up with something OTHER THAN SNOW. And as discussed in prior blogs you don't have to miss those requirements by much, just 1% or less can bust the forecast. Everything must be PERFECT to get snow.
For example the ENTIRE AIR MASS can be below-freezing but you just get drizzle. Why? Somewhere one or more of the other requirements were not met. Maybe the lift was too weak or at the wrong level, or the cloud saturation layer was not cold enough or thick enough.
See what I mean? It takes a meteorological miracle so to speak.
When the 90 or so weather balloons are released across the nation twice a day to sample the atmosphere they transmit the conditions they find which we use to create weather charts of current conditions at various layers of the atmosphere as weather observations. We can also plot this trace on a THERMODYNAMIC DIAGRAM, such as a "Skew-T". Example below:

The computer models generate SIMULATED versions of these based on what it "thinks" the vertical 3D atmosphere will look like in the future. Forecasters analyze all of this information to first diagnose the state of the atmosphere and then to try to predict its future state.
The "atmospheric sounding" on the Skew-T diagram below would be one for SNOW. Because there is sufficient lifting, the red and green lines of temperature and dew point come together indicating moisture saturation including at -10C or colder, and the atmosphere everywhere is at or below 32F 0C:

The sounding below would indicate just RAIN. Because there is insufficient saturation and lift in the snow growth zone, and most of the atmosphere is too warm, especially with the warm nose melting any snow that did try to form. The little cold pocket just a little above the earth is too small to refreeze the drops before it agains falls into 36F air at the surface:

In the sounding below the location is right on the edge where cold rain could mix with or change to freezing rain:

The sounding below could produce SNOW or a wintry mix:

One of the toughest forecast calls to make is when the vertical profile of the atmosphere is or is forecast to be "Isothermal" or "near isothermal". That means the whole of the atmosphere is largely walking the tight rope line between snow or a cold rain. We get that often here in the Metro Atlanta region. An example of that kind of sounding is below:

So there it is, just that simple. Now you give it a shot:
EX A

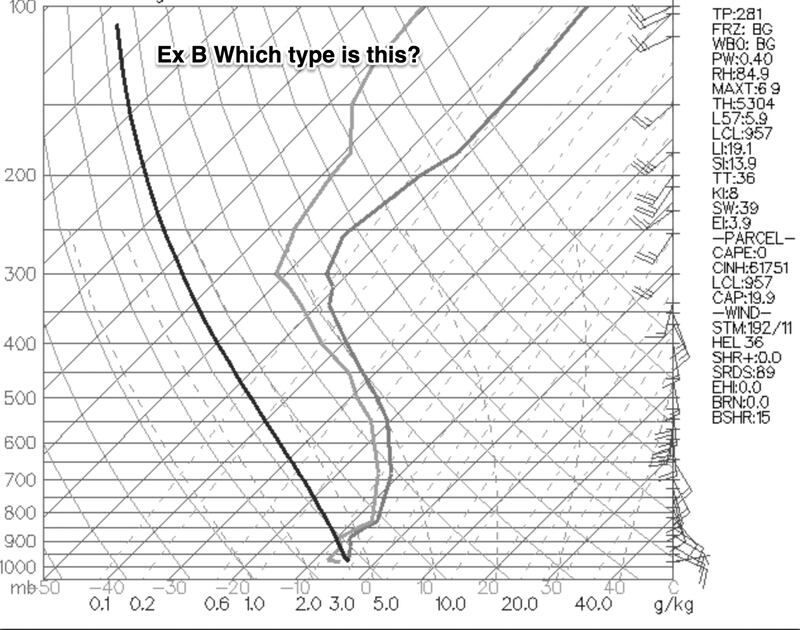
EX B
EX C

I'll give answers in future blog.
Meanwhile, guess what? There are other forecast methods for predicting snow vs. rain or ice! They all have to be used together.
There is dynamic cooling to be considered, evaporative cooling to be considered, air advection to be considered. And of course partial differential thickness analysis to be considered using forecast checklist flow charts and/or a nomogram like this one:

And this one using statistical regression analysis which developed the above chart:\

Just that simple.